
Signal & Noise Filter
This is Wut Stops This Train

For years the resilience of the U.S. economy has been the envy of the world, weathering crisis after crisis as if they were life annoyances instead of existential threats to the business cycle.
Outside of a policy choice to induce a mini (but deep) recession in 2020, the U.S. economy has been in growth mode since 2009, in one of the longest expansions in post-World War II history.
The post-Covid soft landing was the capstone. One can quibble about the when, but ultimately Chairman Powell did put on his big boy pants and rose to the occasion of his personal Volker moment.
Once “transitory” became a four-letter word, Powell shot it in the head:
Inflation fell from a peak of 5.6% YoY in February of 2022 to 2.61% YoY in April of 2025, just before the tariff war.
The labor market was cooled from a generational low of 3.5% in September 2022 to its current 4.4% level without crashing it, and wages embarked on a multi-year descent from inflationary levels to disinflationary ones.
The U.S. economy appeared to be made of Teflon, and no level of policy mismanagement or exogenous shocks seemed capable of breaking it. Number go up.
“Nothing Stops This Train”.
The oil supply shock, and all its attendant second and third order effects on both upstream and downstream suppliers, is going to test this thesis once again.
Evolutions in the U.S. economy (no wage-price spiral, less energy intensity, and energy independence) will insulate it from the worst outcomes and likely avoid a repeat of the 1970’s.
However, the inbound inflation and the accompanying demand destruction will put the Fed in an uncomfortable spot that will become an existential threat to the business cycle.
This is not the collapse - but it is the first real test of the post-Covid resilience thesis.

Last week, the OECD released its economic outlook, which includes its now revised 2026 U.S. growth and inflation projections for 2026. Eyebrows perked up, mouths opened wide, and pearls were clutched.
U.S. headline inflation went up by 1.2% to 4.2%. 😱
U.S. core inflation remained flat. 🧐
U.S. real growth was downgraded by 30-basis points to 2%. 😠
This is the noise, and it is baked in the cake and priced. Markets don’t care and neither should you.
The signal is in the Fed’s reaction function to the evolution of the economy, and its forward prospects, at a future point time from today at T + (when).
Will they or won’t they, is the key question that is most top of mind for investors right now. But the action in question is not “will the FOMC look through an inflationary supply shock and not raise interest rates”?
Of course they will. The above is a given and is first order thinking. It’s the known-known, if you will.
The alpha is in how far and for how long will they look past the supply shock. Every system has its breaking points around its nodes of fragility, as outlined in discussions around supply bottle necks and choke points.
Thus, we must solve for two unknowns:
The future state of the economy, as defined by the growth and inflation matrix, along with the most likely forwarddistributional path of those two variables.
The reaction function of the FOMC as it seeks to balance its dual mandate.
Let’s get after it.
The Timeline of the Squeeze: The Kinetic Reality
The starting point of this analysis is that the Strait of Hormuz is effectively closed until the end of June or even July.
Watch what they do, not what they say: Thousands of U.S. troops are enroute to the military theater centered around Iran. The latest deployments and their required logistical support will take another few weeks. We are now in late April.
Focus on sequential timelines: More threats → actual kinetic action → more negotiations that narrow the spread between competing strategic goals. We are now in May, or even June if the scope of the conflict is broadened.
Wash rinse and repeat.
At some point, the political and economic costs in the U.S., and the military costs in Iran, will force a negotiated settlement with some propagandized label of success for both parties and the oil will flow again, if not in fact at least in negotiated theory.
We are now in late June or early July, before America’s 250th birthday on July 4th, which happens to be the weekend holiday with the most miles driven, which highlights the costs of gasoline and the war (and perhaps even a deeper questioning of the conflict).
And now the real work of re-starting the economy will begin. Upstream suppliers will need four to six weeks to come back online, and downstream will require another four to six as well. Q3 is over and Q4 is upon us.
Pinebrook takes the OECD economic update at face value, except on its expectation for the energy disruption to normalize by mid-2026. This is where Pinebrook and the OECD part ways.
Markets don’t wait and mid-2026 is discounted and already priced. Markets are grappling with the distributional path of H2 2026.
By simply pushing out the recovery timeframe by one quarter, the OECD’s baseline expectations go in the dumpster fire.
Thus, a temporary price shock becomes a multi-quarter inflation and income shock.
The Inflation Tax and the Mechanics of Demand Destruction
Unlike with the Covid Pandemic, the transmission mechanism today will not be through an increase in nominal wages, but rather the compression of real disposible income.
Higher energy and input costs raise prices across the system. But without offsetting wage growth, the result is simple: households become poorer in real terms. Demand and spending fall.
Energy, in this context, functions as a regressive tax. Lower and middle-income households—those with the highest marginal propensity to consume - absorb the largest hit. The result is not inflationary overheating like in the pandemic but rather demand destruction.
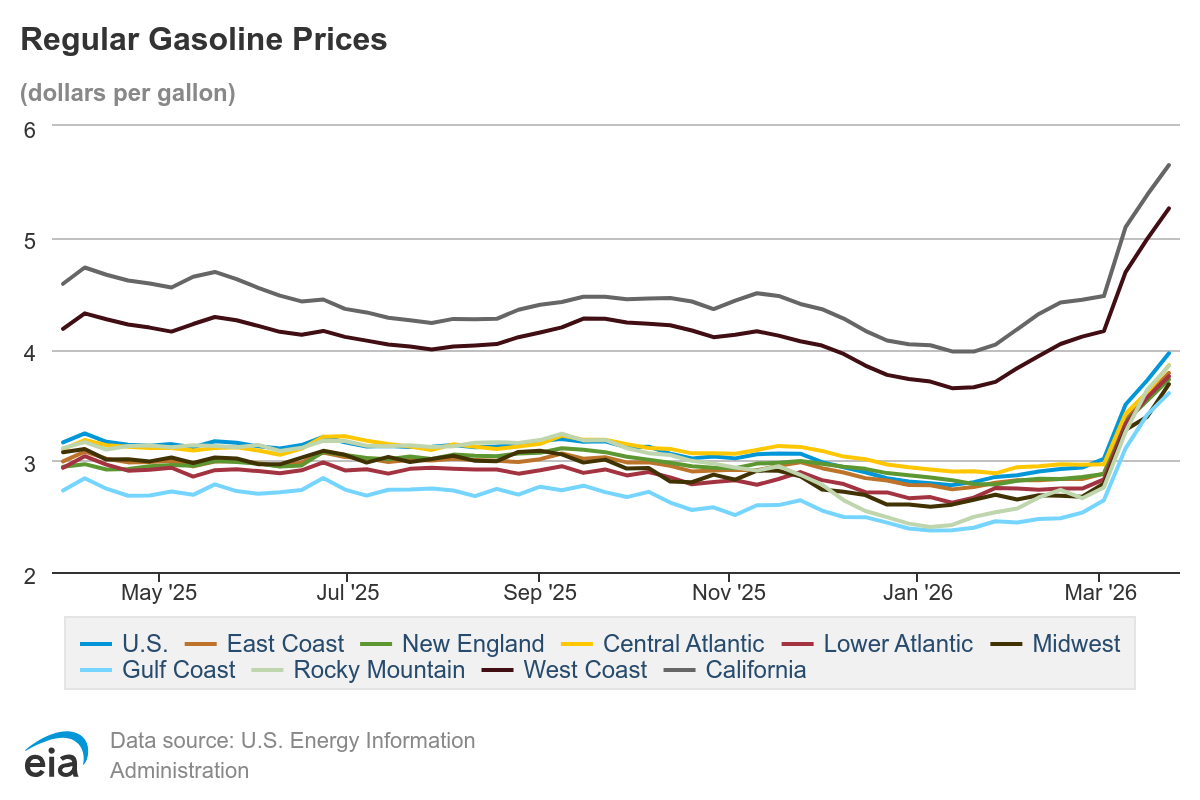
The current 50% spike in crude oil prices is a regressive $150 billion tax levied directly on the U.S. consumer.
The immediate impact of gasoline is felt at the lower 60% of the income distribution. Unlike the upper cohort of the K-shaped consumer market, these households operate on thin margins.
When the cost of a commute spikes, the first casualties are small luxuries – expensive coffee, dining out, streaming services, and discretionary retail.
This is the disposable income cliff, where nominal spending may appear stable due to higher gas prices, but real volumes collapse.
Based on the OECD’s energy shock data (+50% oil price) and Pinebrook’s Hormuz closure timeline (through June/July), here is an estimated energy tax calculation and the impact on real demand and GDP growth.
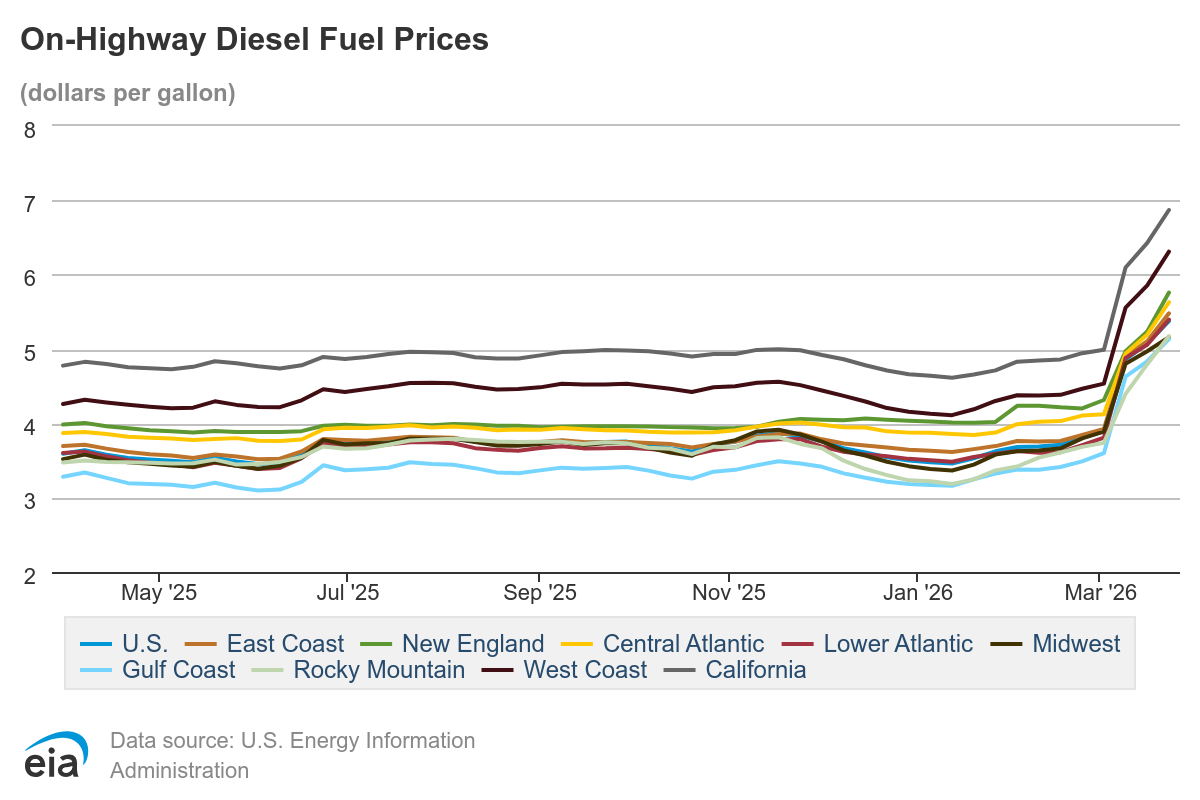
Energy Intensity of Consumption: Energy (gasoline, electricity, heating) typically accounts for ~4-5% of the average U.S. consumer basket, but for the lower-income half of the K-shaped labor market, it can exceed 8-10%.
This shifts an immediate $400–$600 billion in household cash flows from discretionary consumption into energy expenditures.
A 50% sustained increase in energy prices (OECD assumption) translates to a direct 1% to 1.5% hit to total real disposable income across the aggregate consumer base.
Given that Personal Consumption Expenditures (PCE) drive ~68% of U.S. GDP, a 1% decline in real spending translates into roughly .70% of GDP drag before second round effects.
If the Strait remains closed through June/July, this demand destruction shaves 50 – 100 basis points off the old H1 growth projection of zero.
This puts additional pressure on demand destruction by the policy choice to shrink the labor market via changes to immigration policy.
Now, keep in mind the above does not happen in a vacuum. The Ai capex spend is a thing and it is not going away soon. Hyper-scaler Capex is projected at $650bn or 2% of GDP, which has been the primary growth engine in this stage of the cycle and has provided a steady 2.0% growth tailwind.
The Ai capex cycle offsets roughly 100 - 150bps of the energy-driven demand drag, preventing a full recession.
Thus, the economy will experience a balancing act between an energy tax and a structural Ai floor, in an economic context different from the pandemic experience.
However, an equilibrium will not be reached until year end, as the effects of the energy tax are mostly immediate (at the gas pump) while the Ai cycle doesn’t begin to accelerate until Q3 2026 as firms push for more Ai adoption to offset the energy tax.
Mapping the Inflation Trajectory: The Pandemic Mirror and the 2023 Cliff
The inflation trajectory of the Hormuz shock will be more front-loaded and volatile than the pandemic, but also with a faster potential deceleration - provided the abundance regime is not structurally broken.
Unlike 2021, where consumers were flush with cash, the 2026 shock hits a K-shaped labor market with zero net new job growth for over a year. This means the inflation rate will be capped by a collapse in aggregate demand, versus being fueled by excess demand like during the pandemic.
While the pandemic featured a slow-building, multi-year inflationary climb fueled by gargantuan fiscal stimulus and broken global plumbing, the current inflation spike will be almost immediate due to the 50% surge in crude oil prices since the conflict’s onset.
In 2021, the Fed was behind the curve. In 2026, the Fed is in a wait and see mode with restored credibility, which helps keep long-term inflation expectations anchored, unlike the immediate post pandemic experience where Fed credibility came into question for the first time in 40 years.
One approach to mapping out the inflationary sequencing is to overlay the parabolic inflation rates of March - September 2021 onto our current trajectory, then apply the September - December 2023 inflation cliff as our Q4 proxy.
Easy peasy, cut ‘n paste init?
Unfortunately, no. Adjustments need to be made to account for the OECD’s projection that supply chains are running below 85% capacity, and thus inflation will be higher in the short term before a supply side flush starting in late Q4 2026.
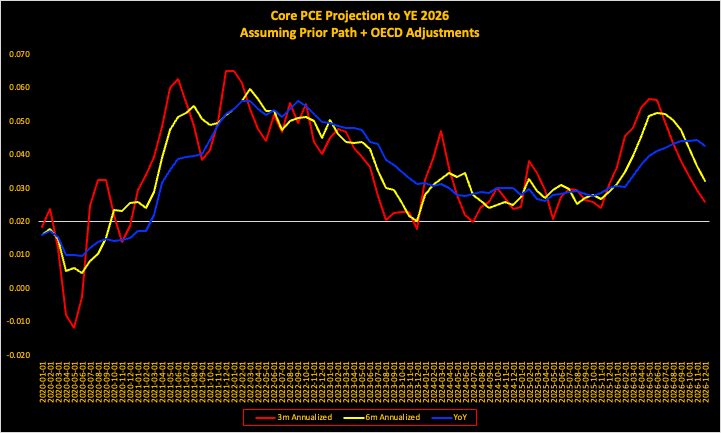
In table form, the distributional path looks like this.

In effect, a modified accelerated, deeper, and compressed timeline of the pandemic supply shock experience.