
Market Commentary
The Great Un-Rotation

Preamble: Individual securities that are listed in this note should not be taken as a recommendation (or solicitation, for the regulators watching at home). The purpose of their mention is to orient investors and traders on where to look for opportunities in the same sub-asset bracket or ecosystem.
Since late February, markets have entered a rates-volatility regime characterized by rising nominal yields, rising real yields, rising break-evens, and modest term premium expansion, with the MOVE index breaking higher but credit spreads still broadly contained outside the lowest-quality tail.
That said, spreads have begun to widen directionally across the stack, with the most pronounced stress emerging in lower-quality credits. The trend matters more than the level.
This is not a recession signal. It is a repricing of risk under tighter financial conditions.
Equity price action is consistent with a crowded cyclical/breadth unwind rather than a recession signal: broad industrials, materials, and equal-weight exposures have been liquidated, while energy remains resilient and washed-out tech has stabilized.
The market is therefore pricing a supply shock and tighter financial conditions simultaneously, but not yet a macro breakdown. Leadership is likely to remain narrow and selective until either rates volatility subsides or credit stress broadens.
The 493 rotation trades that worked best in January and February got torched in the first two weeks of March. XLI, XLB, and RSP.
Tech names (QQQ, MAG7, software) that got rinsed in January and/or February suffered least in the first two weeks of March.

As of close March 19, 2026
Trading the Industrial Aftershocks
Last week’s Signal & Noise Filter framed the new trilemma clearly enough:
Job’s Day noise.
Geopolitical shock.
Stagflationary supply shock.
The subsequent U.S. Economic Growth Update went deeper into the macro plumbing and made the more important point: the real risk is not simply weaker GDP in H1, but the possibility that persistent supply instability begins to impair productivity and chips away at the post-pandemic abundance regime.
This note is about the portfolio expression of that view.
The trades have already been put on as mentioned on Monday. The purpose of this note is to explain the logic underneath those positions and, more importantly, to tie them into the broader cross-asset signals that markets are currently sending.
This is not a recession trade.
This is not a broad cyclical reflation trade.
It is a supply-shock inflation-volatility trade expressed through the industrial aftershocks of a prolonged disruption.
A disruption that has created aftershocks, each with second and third order effects, that are baked in the cake and will manifest themselves in the future regardless of when the war is ended.
No one knows how long hostilities will last and when a negotiated political settlement is forged between the U.S. government and by whatever is left of the Iranian one.
But we don’t need to know….
Markets do not need a full oil supply collapse to spike prices, they only need fragility. Three structural facts matter.
The oil market has almost no spare capacity. The result is a market that can move non-linearly, and you don’t need a catastrophic disruption to get extreme price moves.
Supply growth has been structurally weak. Because of this, global supply growth is slow even when prices rise. When a shock happens, the market cannot quickly increase production to offset it.
Oil shocks propagate through the entire cost structure. Oil is a central input into the global economy. It affects everything….
These structural factors lead to outsized macro impacts because of the fragility of the system, where price spikes become convex.
Even if the war ends tomorrow, inventories have already shifted, shipping routes have changed, and supply chains must rebalance.
Thus, the real investing question isn’t how long the war lasts, but “which supply chains are already distressed enough to cause structural (not temporary) shortages”.
The answer lies not in the obvious commodities themselves, but in the industrial aftershocks that ripple through supply chains.
The Nature of Supply Shocks
Markets often respond to geopolitical disruptions by immediately bidding up the most obvious commodity.
→ Oil rallies → Energy equities rally → Commentary focuses on the price of crude.
But history shows that the largest equity returns rarely occur in the first commodity affected by the shock. They occur in the industrial bottlenecks downstream of that commodity.
Commodity cycles follow a predictable pattern:

Most investors stop at Stage 1.
The opportunity usually lies in Stages 2-4.
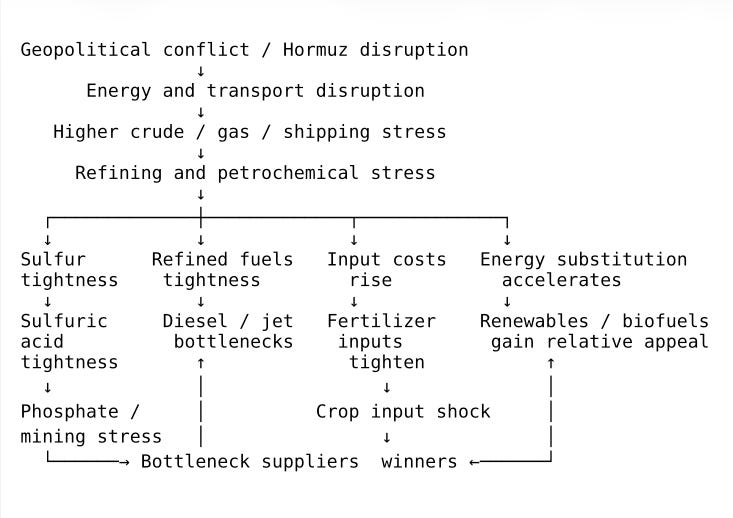
The Supply Shock Transmission Chain
To understand how the current disruption propagates through the economy, we must map the industrial chain.
The war-driven supply shock begins with energy and transportation disruption but quickly spreads through the petrochemical and fertilizer systems.
Geopolitical conflict → Energy supply disruption.
Refining & petrochemical stress → Sulfur & chemical feedstock shortages.
Fertilizer & industrial input shortages → Energy substitution and biofuel demand.
This sequence describes the industrial aftershock mechanism. Importantly, each stage produces a different set of sector winners. Below is a schematic diagram of the supply shock tree.
The Hidden Bottlenecks
In commodity cycles, the bottleneck asset outperforms the commodity itself. Some historical examples include:
Fracking boom → sand companies
Lithium boom → spodumene processors
Shale boom → pipeline MLPs.
Thus, one of the more interesting observations emerging from this analysis is that the critical bottlenecks may not be crude oil itself. Instead, it appears to lie deeper in the petrochemical chain.
Sulfur is the hidden hinge. Sulfur production is closely tied to oil and gas refining / processing as a byproduct. If refining or gas processing is disrupted, sulfur availability tightens. Sulfur is the key feedstock used to produce sulfuric acid.
Sulfuric acid is essential for phosphate fertilizers, copper and uranium mining, and numerous chemical processes.
Phosphate fertilizers are highly exposed because they need sulfur / sulfuric acid. Phosphate producers can be both victims of sulfur inflation and beneficiaries of higher finished fertilizer prices. The trade works best where the producer has better asset position, procurement, and ability to pass through costs.
Nitrogen fertilizers do not depend on sulfur in the same direct way phosphate does, but it often works as a sympathy / substitution / broader ag-input tightness trade.
In uranium mining (and mining in general), sulfuric acid is valued for its leaching properties and separating uranium from the ore.
Finally, sulfuric acid is unusual in that it is difficult to transport long distances, it is a dangerous chemical, and storage is limited. The market is thus regional and extremely tight. This amplifies shortages quickly.
This is what differentiates a true bottleneck from a commodity: it is not globally fungible, not easily scalable, and not easily substituted.
Thus, the winners are not “chemicals” in general. They are the names with lower-cost feedstock, geographic insulation from Gulf feedstock disruption, and enough market power to pass through costs. Investors should not simply chase chemical beta.
In other words, more regional feedstock advantage and market-share / spread improvement than pure sulfur exposure.
Chemtrade (TSX: CHE.UN) is one of the cleanest public expressions the sulfur trade bottleneck. Chemtrade is one of North America’s largest suppliers of industrial sulfuric and merchant acid. If merchant acid stays tight, Chemtrade is a direct pricing-power expression of the shortage. It is closer to the bottleneck than broad commodity names.
Ecovyst (ECVT) is the largest sulfuric acid regenerator in North America and a leading North American producer of virgin sulfuric acid.
In the world of phosphate fertilizers, Mosaic (MOS) is the obvious listed name here. Mosaic recently extended phosphate production curtailments in Brazil due to the sharp increase in sulfur prices.
CF Industries (CF) is a less pure sulfuric-acid exposure than MOS, but if global fertilizer balances tighten broadly its products become a viable substitute.
Intrepid Potash (IPI) makes Intrepid Trio, a custom blend for row crops nutrition consisting of potassium, magnesium, and sulfur.
An indirect beneficiary of high sulfuric acid prices is the Sprott Physical Uranium Trust.
In the world of petrochemicals, Asian petrochemicals are vulnerable if Gulf feedstocks and refining throughput are disrupted. The better-positioned public equities are those with North American feedstock flexibility / advantage:
Dow (DOW) has feedstock flexibility and uses financial and physical hedging, though it also warns it cannot always immediately pass through higher feedstock and energy costs.
LyondellBasell (LYB) has an olefins/polyolefins footprint, substantial liquidity, and advantaged ethylene position in North America.
American Edge
The U.S. is no longer the 1970s oil importer. It is now a major exporter of hydrocarbons and refined products, which hardens its supply chains as well as making it a beneficiary of the FX transmission channel.
The U.S. exports large volumes of crude oil, LNG, refined petroleum products (diesel, gasoline, jet fuel), and petrochemicals. That means when global energy prices rise foreign buyers must obtain USD to purchase those exports.
The petrodollar flow now works differently. Historically (1970s–2000s), an oil price spike led to U.S. trade deficit widening → dollars flow abroad → USD weakens.
Thus, the mechanism is more balanced. An oil price spike today can lead to higher U.S. export revenues → improved U.S. energy trade balance → stronger USD demand. Unlike the 1970’s, the dollar strengthens or stay firm during an energy shock.
A big part of U.S. energy exports is not just crude but refined fuels. Diesel, jet fuel, gasoline, and petrochemical feedstocks. In supply disruptions, these exports often surge because U.S. refineries have scale, feedstock access, global distribution networks via American ports and inland waterways.
The United States is one of the most, if not the most, geographically advantaged nations on the planet.
Among these refined fuels is diesel. Diesel is the industrial fuel of the global economy. Diesel powers trucking, shipping, rail, mining equipment, construction machinery, farm equipment, backup power, and industrial generators. It is the fuel of the physical supply chain.
When diesel markets tighten, it means the real economy is short an essential input.
These are companies where diesel crack spreads drive earnings.
Valero Energy (VLO)
Marathon Petroleum (MPC)
Phillips 66 (PSX)
There are second-order beneficiaries of diesel market tightening.
Darling Ingredients (DAR) supplies feedstock for renewable diesel. If petroleum diesel prices spike renewable diesel margins expand.
Neste (Neste Oyj) is one of the largest renewable diesel producers globally.
Peabody Energy (BTU) markets low sulfur coal, primarily for use by electric companies.
Scarcity trades only work for producers, not users.
This is a critical distinction. Within materials/industrials there are two types of firms:
Input producers such as fertilizer companies, mining companies, and chemical producers. These can benefit from scarcity.
Input consumers such as construction firms, machinery manufacturers, and transportation companies. These get crushed because their costs rise faster than prices.
This is why industrials can underperform in supply shocks. Many industrial companies operate on fixed-price contracts. At the same time, they are capital intensive with high fixed costs, as well as energy intensive. If input costs surge, they cannot immediately pass those costs on. Thus, their margins compress.
Portfolio Implementation
The reason to lean into this trade now is not simply the geopolitical shock. It is the interaction between that shock and tightening financial conditions.
Real rates are rising, credit is deteriorating at the margin, and broad cyclicals are being de-risked. This forces markets to move away from broad beta and toward more selective expressions of scarcity.
That is the transition we are now seeing.
Thus, earlier this week Pinebrook initiated positions designed to capture these downstream supply shocks in the context of tightening financial conditions.
The positions were implemented through sector ETFs rather than individual equities to reduce company-specific risk and maintain focus on the macro regime.
This structure reflects Pinebrook’s core investment philosophy and edge in identifying macro regimes and sectoral implications, not in selecting individual companies.
The objective is to isolate macro factor exposure rather than company-specific outcomes.