
Signal & Noise Filter
Policy Failures Mask American Exceptionalism

It is day five since the commentariat has twisted itself into a pretzel trying to figure out the meaning of Chair Powell’s Jackson Hole speech, which has been reduced to a “will they or won’t they” cut in September question.
This is the noise and reflects the abysmal state of macroeconomic analysis, and why these pages have abstained from early commentary.
What matters is not what Powell said, but what the market thinks about what he said.
On Monday, August 18th, the odds of a 25-basis point cut in September were 82.69%, according to the CME Fed Watch tool.
As of this writing they are 87.2%.
The market didn’t care.
In short, a true dovish Fed response would have been a hard commitment to cut in September. A true hawkish Fed would have ruled out a September cut. Neither one of these things happened.
The only thing that was committed to was an adherence to data dependency. And the market agreed by hardly budging beyond short covering in the bond market and position squaring in the stock market.
The bigger macro development is the lag in U.S. asset performance in August versus rest of world (“RoW”) ones. This is the signal.
Starting with the U.S. dollar, which sold off on August 1st with the release of the jobs day report, and again after Chair Powell’s speech at Jackson Hole.
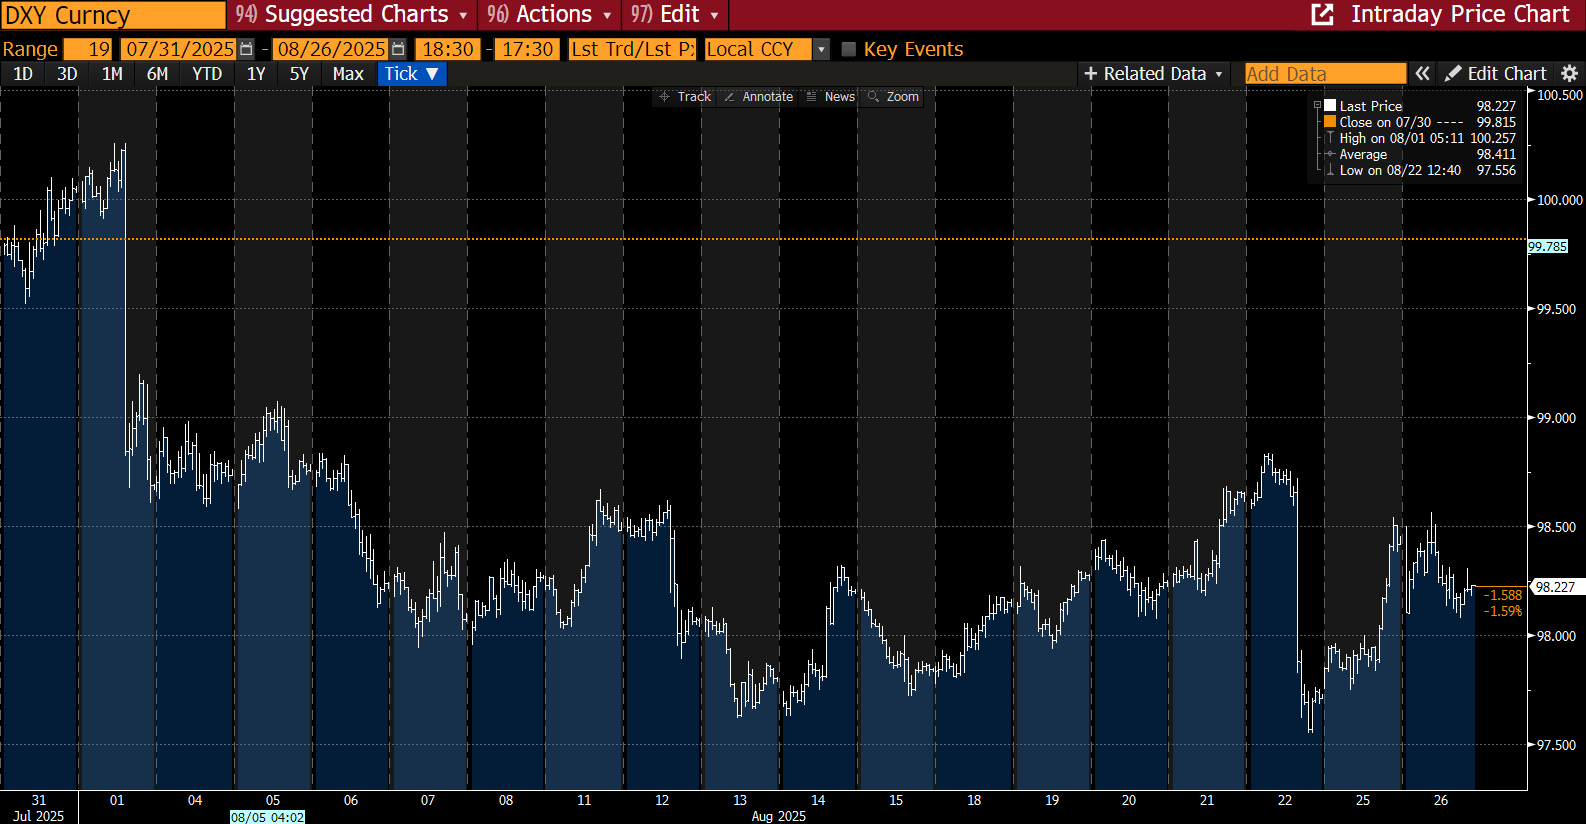
Until July 31st, U.S. assets handedly outperformed RoW ones since TACO, but have lagged during the month of August (as of August 26, 2025).
Gold, which has been flat since late April, accelerated in August.

The re-pricing of the dollar and the loss of momentum in U.S. risk assets reflects a shift in U.S. growth expectations, Fed policy, and U.S. interest rates relative to RoW ones.
Unlike when U.S. assets were over-sold relative to RoW ones by 3-4 standard deviations in April, there is no obvious trade right now among global assets.
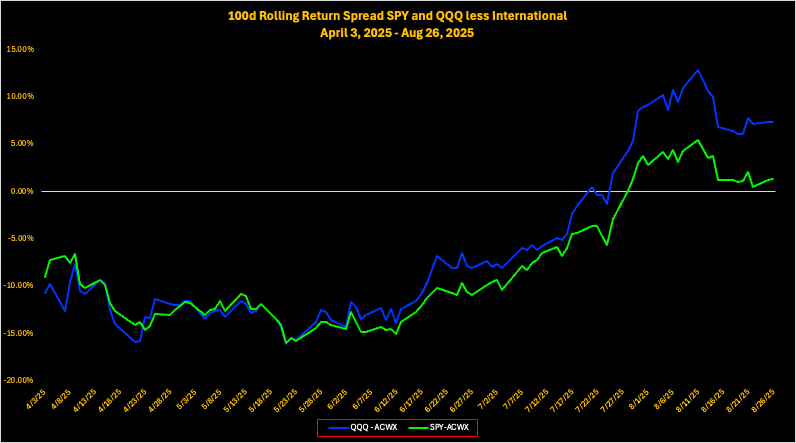
The rolling 100-day performance spread between U.S. assets and RoW ones has mean reverted to, or is at, near 10-year averages. Below is a table which breaks down these relationships.

This chart here provides a visual representation of the recent rolling 100-day return between U.S. assets and RoW ones.
As can be seen in the chart below, prior episodes of mean reversion between U.S. and RoW assets have typically over-shot in the opposite direction, and after doing so, have persisted in favor of U.S. assets.
That is, persistent U.S. outperformance is the standard expectation, while persistent underperformance would be the anomaly.
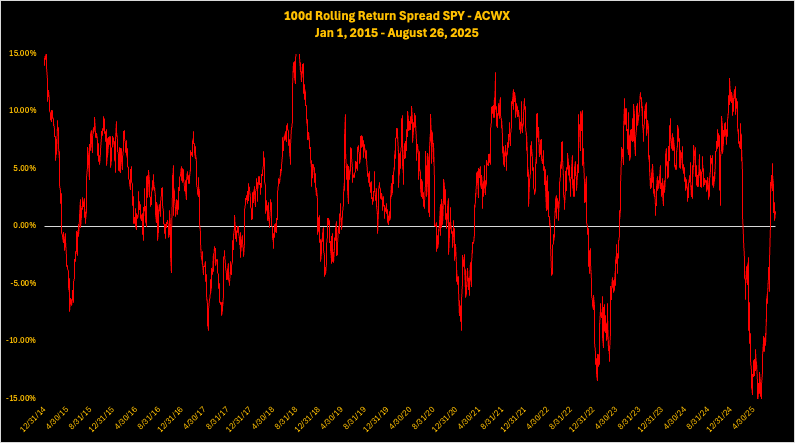
Thus, the question for global investors is if this time is different.
Does the stall in U.S. assets in August presage future relative underperformance?
Will U.S. exceptionalism re-assert itself and give the red line above another leg up after its August stall?