


A week ago, these pages called:
The US pullback likely over at the November 5th bottom.
Named the Fed as the new area of stress.
Set credit as the tell.
The Fed as the new area of stress checks out, and it is putting pressure on the November 5th bottom-call thesis. The bottom has held.
The pressure from the Fed has not gone away, and it is going to get worse before it gets better.
That is not a reason to be bearish.
It is a reason to be precise about the path.
In November 2023 these pages called the soft landing before the consensus did. Last week these pages deployed the same framework to call a local bottom after Cruel Summer turned into a bull head fake into the fall.
Building on last week’s process, it is the conclusion of these pages that the Fed is going to land it again, and there will be no recession in 2027.
That said, it’s going to be bumpier than in 2023 simply because the current inflationary episode is no longer a transitory supply shock.
The current inflationary episode has morphed into a more broad-based inflation, which in addition to WWII-sized deficits that never seem to stop, has been aided and abetted by the wall of money from the AI-capex infusion.
The re-pricing of AI-capex makes it more expensive, but it doesn’t kill it.
In addition, the 2027 soft landing trajectory will land on different parts of the market.
Nominal demand: nominal GDP is growing 5.9%. A Fed win looks like about 4%. S&P earnings growth does not go to zero until about 2.5% NGDP. Thus, the Fed has room to slow the economy without breaking earnings, and it has not even gotten started yet.
The channels: a 6.4%-of-GDP deficit at full employment, household interest income that rises with every hike, mortgages locked at low rates, and construction workers who moved instead of being laid off. The normal ways the Fed slowed the economy are blocked or rerouted.
Inflation: our tested path keeps 3-month core PCE at or above 3.1% at every meeting through June. Rents have cooled from earlier in the cycle but are re-accelerating at the margin; the broadening is in everything else.
The Fed: with unemployment at its low and core above 2.75%, the Fed hiked at 9 of 10 meetings in three cycles. Fed funds futures price 82bp of hikes through September 2027. Labor at its low gives ~144bp.
The bump: AI revenue is growing 28% and carrying the index. The median company’s revenue is growing 2%, with debt rolling at higher rates. The stress lands in breadth and single-B, not the index.
Positioning: own AI, short the front end, hedge credit. Rotate into breadth when single-B peaks. Flip the rates trade to long when labor turns.
1. Why It Lands Again: Nominal Demand
Recessions are about real output. Earnings, wages and debt payments are nominal. The Fed has to slow nominal demand, and current nominal demand is not slowing.
In 2022, every recession model looked at the yield curve, the leading indicators or real money growth. None of them looked at the level of nominal growth.
Through the whole 2022–24 hiking cycle, nominal GDP never grew slower than about 5%, total wages paid never slower than 4.3%, and nominal consumer spending never slower than 4.5%.
The slowdown was real but the level never got near the point where things break.
The Fed hikes => yields moon => everything breaks (term premiums, ERP, multiples, earnings, and ultimately recession) model that everyone was tripping over themselves to embrace was a hard fade by these pages precisely because these pages recognized the above.
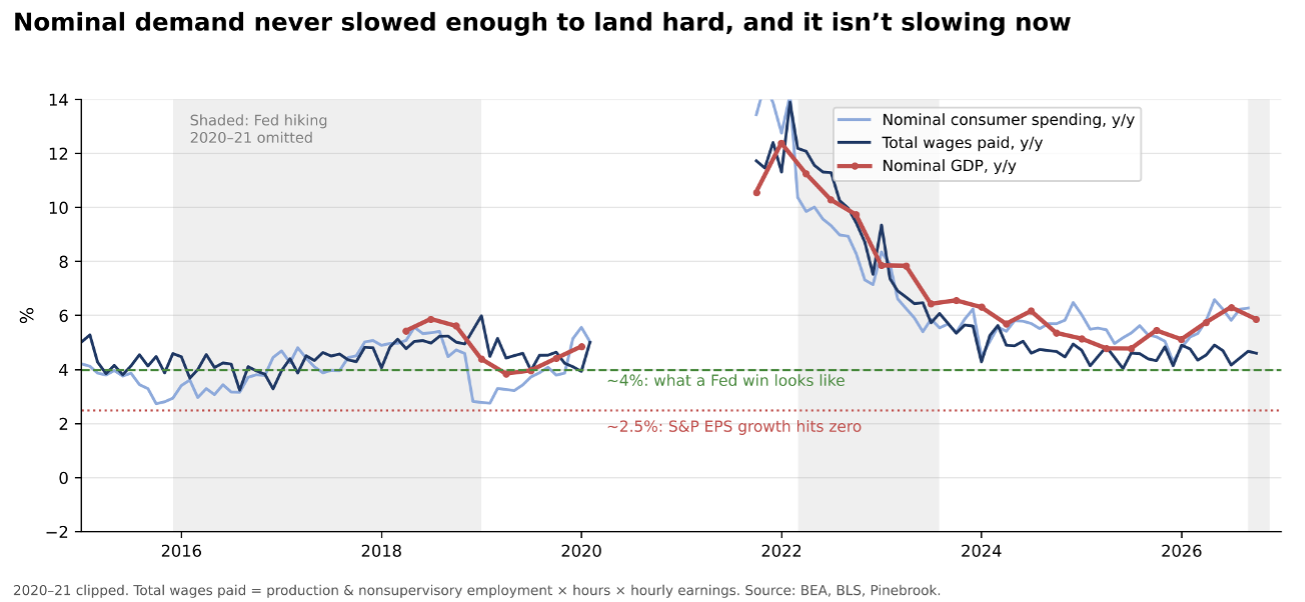
It is the same today, and it is moving the wrong way for the Fed.
Nominal GDP grew 5.9% over the year to Q3.
Nominal consumer spending is up 6.3% and accelerating.
Total wages paid are up 4.6%, and 5.3% annualized over the last three months, up from 2.3% in July.
In September 2023, these pages put the nominal GDP consistent with a soft landing at “around 4%, give or take a percentage point.” The arithmetic is the same today.
We measured how S&P revenue and earnings move with nominal GDP since 2001:

Quarterly, 2001–2026 excluding 2020–21. Source: Bloomberg (SPX trailing 12-month sales and EPS per share), BEA, Pinebrook.
A Fed win takes nominal GDP from about 6% to about 4%. Through the betas, that costs about 3 points of revenue growth and about 9 points of EPS growth.
That is an earnings slowdown, not an earnings recession.
An earnings recession needs nominal GDP below about 2.5%, more than three points below where it is. Nothing in hand says that is coming.

Source: Bloomberg, BEA, Pinebrook.
2. Why the Fed’s Usual Channels Don’t Work
The Fed slows nominal demand through credit, housing and jobs. Today each of those channels is blocked, rerouted, or working in reverse.
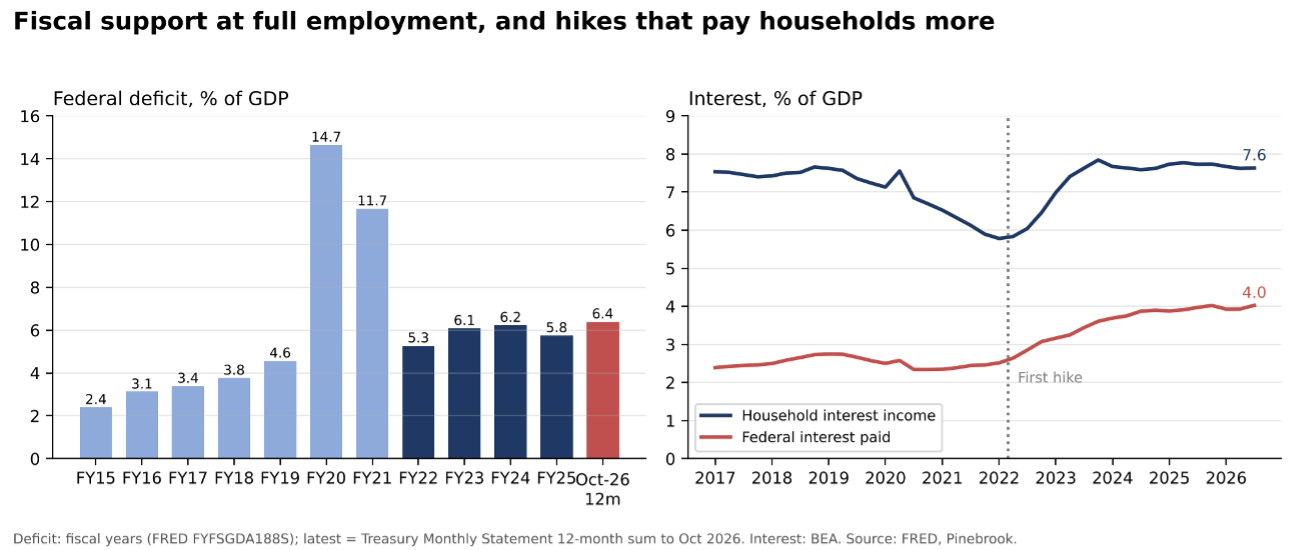
The deficit. In September 2023 I called them “WWII-style deficits.” They are bigger now. The federal deficit over the 12 months to October was $2.11 trillion, 6.4% of GDP, with unemployment at its low. Fiscal policy is adding to demand while the Fed tries to take it away.
Hikes pay households. Household interest income is 7.6% of GDP, up $1.06 trillion a year since the first hike in March 2022. Federal interest paid has gone from 2.5% to 4.0% of GDP. Every hike raises what the Treasury pays and what households earn on cash. With debt this size, the Fed’s brake is partly wired to the accelerator.
Mortgages are locked. Roughly half of outstanding mortgages still carry rates below 4%, nearly all of them 30-year fixed, and about 40% of homes have no mortgage at all. Hikes reach new buyers, not the stock of homeowners.
Housing jobs didn’t break. They moved. In 2023 I argued that there would be no housing-led recession, because housing employment never fell, even as volumes went ice cold. The “so goes housing, so goes the economy” thesis runs from housing activity to housing jobs to household income. It broke at the second link.
Workers went from new homes into renovation, and from residential into nonresidential building, including the factories and data centers of the AI buildout.
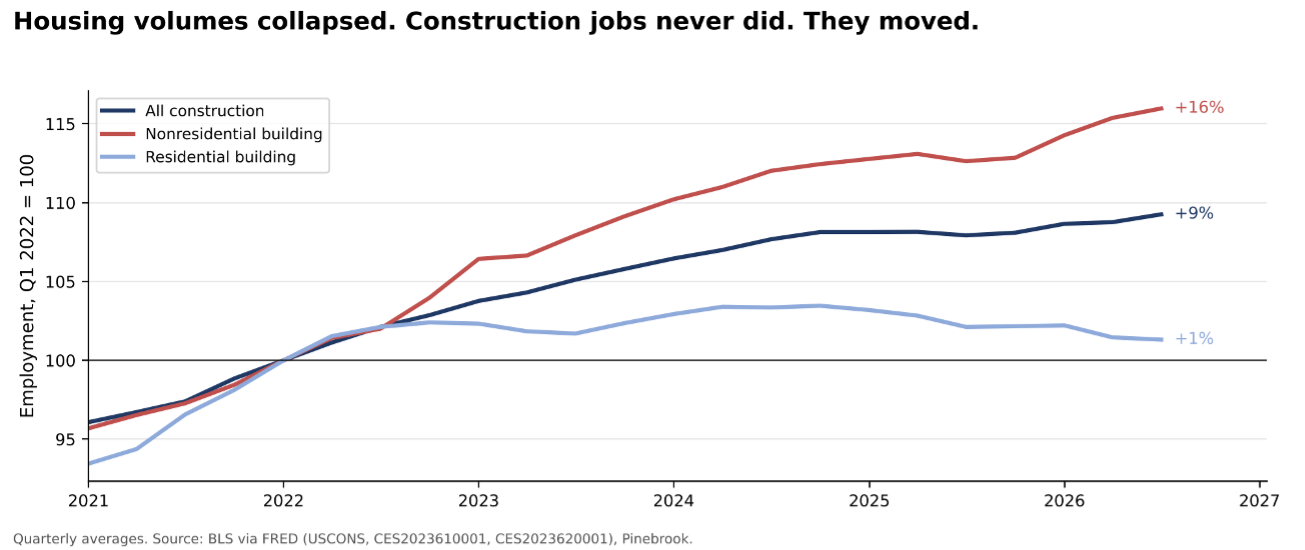
Since Q1 2022, construction employment is up about 700,000, or 9%. Residential building employment is roughly flat. Nonresidential building is up 16% and still rising this year. Housing has already had its slowdown.
There is little left in it for the Fed to break, which means the Fed cannot count on housing to slow nominal demand for it.
3. The Numbers: The House Inflation Path
January runs hot every year, and this one starts from a 0.24% trend, not a 0.17% one.
We do not guess the first quarter. The path below is the second half’s trend plus the average amount by which each early-year month has run above that trend since 2001 (excluding 2020–21). Tested out of sample on every year from 2012 to 2026, it beat the best simple rule by 14% overall and by 26% in January. It has no edge in February or March, so we treat those months as trend.
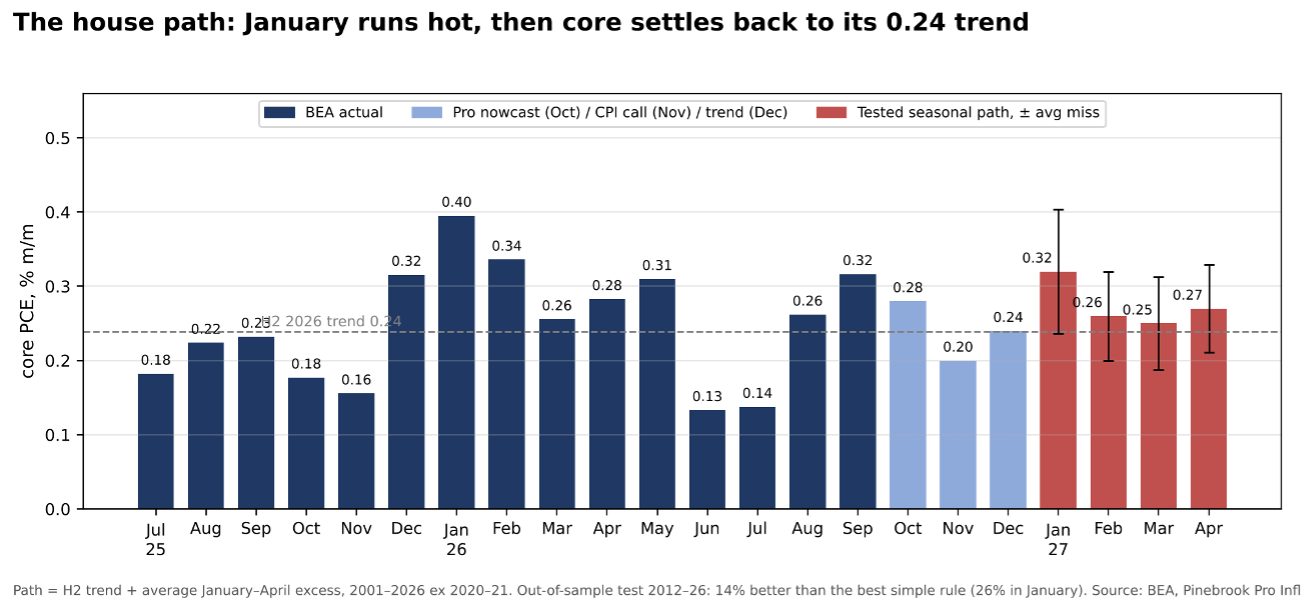

October from the Pinebrook Pro nowcast, November from our CPI call, December at the H2 trend. 2026 Q4/Q4 core PCE: 3.2%. 2027 Q4/Q4: 2.7% if May–December runs at 0.20%, 3.1% at 0.24%.
In 2023, these pages called the landing by stripping out shelter: core ex-shelter was already below 2%, and rents were going to follow. The same cut today says the opposite.
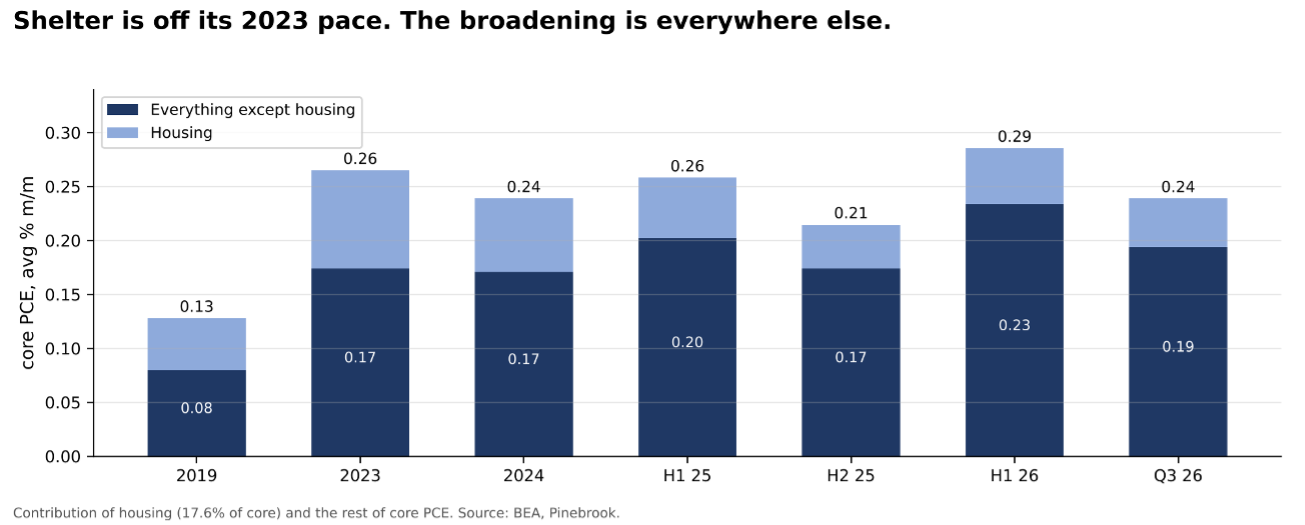
Housing’s contribution to monthly core PCE has fallen from 0.09 in 2023 to 0.05, already back to its 2019 pace. Everything else contributes 0.19 a month, against 0.08 in 2019.
Rents have cooled relative to earlier in the cycle, but they are re-accelerating at the margin.
CPI shelter is running 3.9% annualized over the last three months, up from 2.1% in August, led by owners’ equivalent rent, while rent of primary residence is flat at about 3%.
That is the affordability squeeze from our CPI call: households priced out of buying are renting homes like the ones owners live in, which is what owners’ equivalent rent measures.
The broadening is everywhere else, and January’s seasonal jump comes entirely from outside housing. Shelter is now an upside risk to the path, not a cushion.
4. The Reaction Function: The Fed Stops When Labor Does
Inflation tells you whether the Fed hikes. Labor tells you when it stops.
We tested every hike-or-hold decision from first hike to first cut in 2004–07, 2015–19 and 2022–24: 77 meetings, using data as the Fed had it. No formal rule beat the base rate out of sample, so we are not presenting one.
One variable survived every test: how far unemployment has risen from its 12-month low.
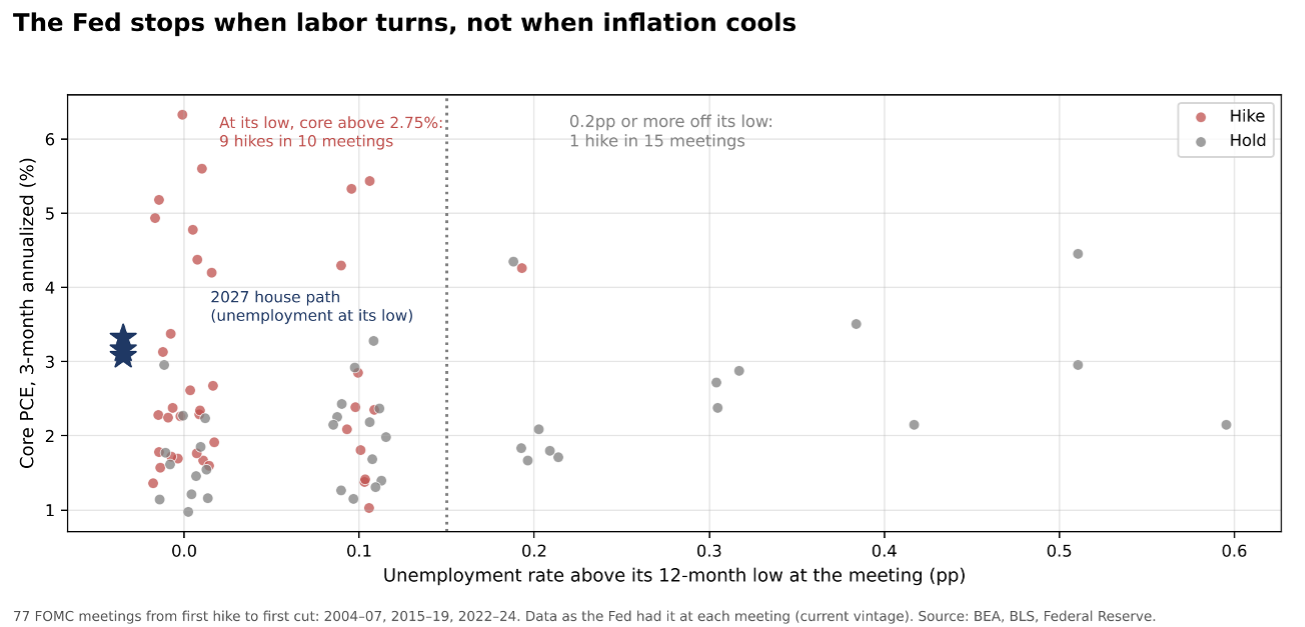

Source: BEA, BLS, Federal Reserve; Pinebrook. The one hike 0.2pp off the low was July 2023, with core running above 4%.
Unemployment against its recent low is not a new variable. It is the same one behind the Sahm rule, and behind one of the cleanest tables in macro, from our friends at Employ America: since 1949, every time unemployment rose 1pp within a year, there was a recession, and in every case but one it rose at least another 1pp.
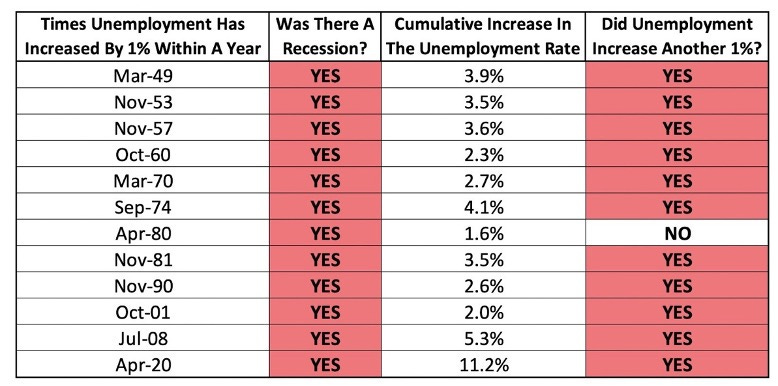
Source: Employ America.
That table answers a different question from ours. It tells you when a recession has started.
We are looking for something earlier: when the Fed stops tightening. And the Fed acts on a fraction of the recession signal. At the last hike of each of the past three cycles, the Sahm indicator read between 0.00 and 0.07, against its 0.5 recession trigger.

Sahm indicator: 3-month average unemployment rate minus its 12-month low. Source: BLS, Federal Reserve, Pinebrook.
The Fed stops long before the recession signal fires. That gap is the soft landing.
In 2006 and 2018 the Fed stopped well inside it; in 2023 it stopped at the edge, and the economy landed anyway.
Once unemployment is 1pp off its low, the table above says it is too late. The call rests on the Fed stopping at 0.2pp, not 1pp.
Unemployment is 4.1%, its 12-month low. With core at or above 3.1% at every meeting through June, the Fed is in the top row and stays there until labor breaks. A March pause needs unemployment at 4.3% by the January or February report.
Initial claims were 203k in the November payroll survey week, and the 4-week average is 197,750: layoffs are still low. But continuing claims jumped 70,000 to 1.763m, 4.1% above the 12-month low they set the week before.
Continuing claims are the best real-time read on our stop variable: since 1990, monthly continuing claims about 2.4% above their low have matched unemployment 0.1–0.2pp off its low, and about 4% above has matched 0.3pp. One week is not a month. But this is the first crack in the variable the whole call rests on, and it is where we look first.
The November jobs report in early December settles it. Unemployment at 4.1% keeps the house path.
At 4.2%, the Fed is in the 0.1pp row, where it hiked about half the time, and March becomes a coin flip.
At 4.3%, the Fed stops after January, the front-end trade is wrong, and we move straight to the third stage.
5. The Policy Path: Where Pinebrook Sits vs. Le Marché
December and January are priced. The spring is not.
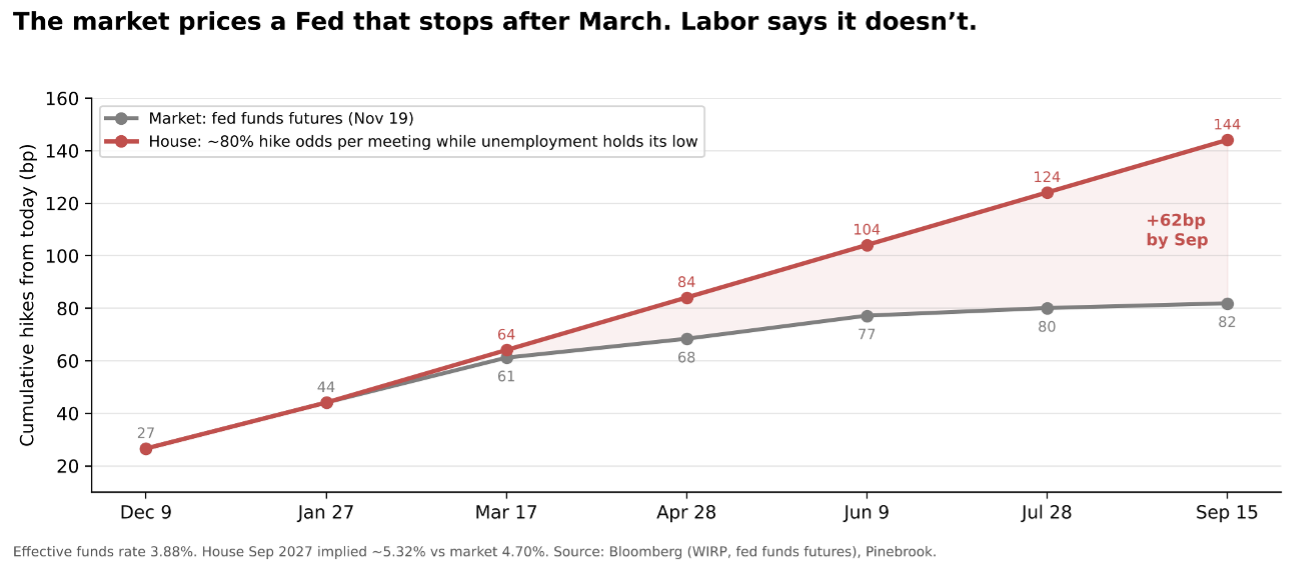

Market: fed funds futures (Bloomberg WIRP), Nov 19. House: ~80% hike odds per meeting while unemployment holds its low. Funds midpoint today 3.88%.
Fifty basis points in December 2026 is noise.
The cool PPI took it off the table.
A hike in December and another in January are priced and coming.
The edge is after that: the market prices a Fed that all but stops after March: 7bp for April, 9bp for June, and 5bp for July and September combined. Our path puts the 2-year 25–35bp above today’s 4.83%, around 5.05–5.15%.
The December meeting is where it first shows. We expect higher dots.
A 2027 core PCE projection of 2.7–3.1% (from 2.5%).
A lower unemployment projection (3.9–4.0%).
And a median terminal rate near 5.25%.
The real (inflation-adjusted) funds rate is about 0.7%, against the Fed’s own 1.2% estimate of neutral.
Given the channels above, each hike does less work than the Fed’s models assume. The committee will need a higher rate to get the same restraint.
6. Why It’s Bumpier: Two Markets
The index and the median company are living in different economies. The bump lands on the second one.
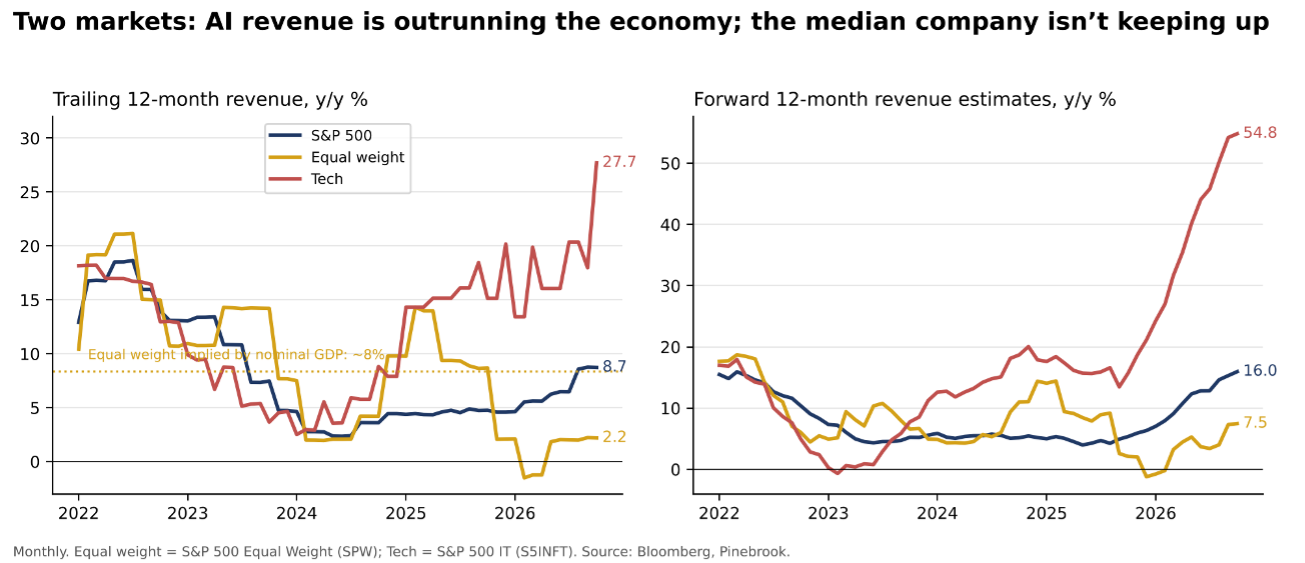

Equal weight = S&P 500 Equal Weight; Tech = S&P 500 Information Technology. Equal-weight per-share figures move with quarterly rebalancing. Source: Bloomberg, Pinebrook.
With nominal GDP near 6%, the betas say the typical company’s revenue should be growing about 8–9%. It is growing 2%. Nominal demand is not short. It is going to households, government, private companies and the AI buildout, not to the median listed company.
Index earnings are AI earnings: tech forward EPS is up 89%, and tech margins have gone from 27% to 36%.
In September 2023 I wrote that the maturity wall was “a feature, not a bug”: borrowers who had refinanced before the hikes were insulated, and I put the problem in late 2024 or early 2025. That buffer has now run out for the companies whose revenue has stalled. In 2022 the median company was protected by revenue growing with prices while debt payments stayed fixed. Today it has 2% revenue growth and debt rolling at higher rates. That is single-B.
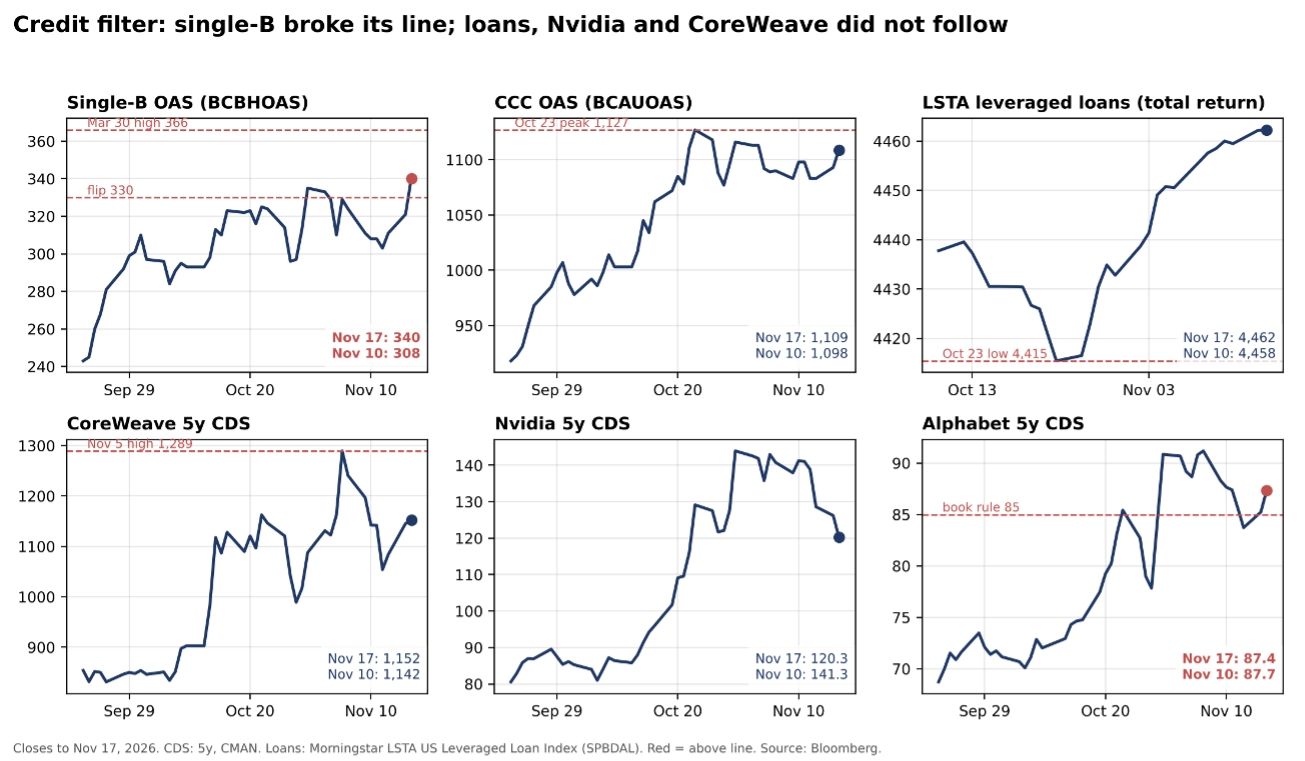

Index earnings are exposed to the Fed through the credit that funds AI capex, which is why CoreWeave matters.
The median company is exposed through revenue that has stalled and debt that is repricing, which is why single-B matters.
Loans at a new high and Nvidia credit tightening through a CEO resignation do not look like 2018.
CCC at its peak is the line to watch.
What happens to rates, credit and the multiple depends on which of these two channels breaks:
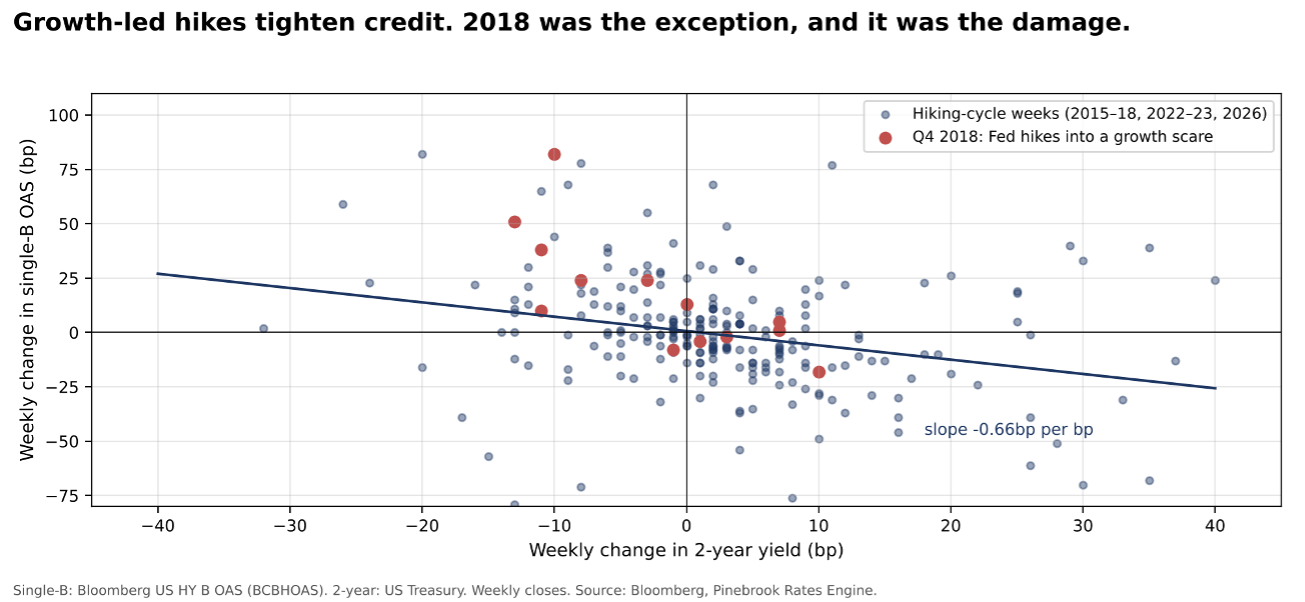

Weekly closes, 2015–Sep 2018, 2022–23 and 2026 (233 weeks). Q4 2018 excluded and shown separately. Source: Bloomberg, Pinebrook Rates Engine.

Each 10bp of required return is worth about 0.7% on the index. Since 2011, single-B explains about 64% of the equity risk premium; adding nominal growth adds almost nothing. Source: Pinebrook, Bloomberg, Damodaran.
With nominal demand this strong, the 2018 case needs credit to break on its own, from refinancing at stalled companies, while the economy is fine.
That is the bump.
It is not the end of the cycle. In 2018–19 the Fed could cut in January with core under 2%. With core at 3.2% it cannot, so a credit scare this time is resolved by the Fed stopping, not cutting, once labor turns.
7. The Path, and the Trades
Destination: no recession in 2027, and a broader bull market once the Fed stops. The sequencing matters.