

Last week’s flush now bears the signatures of a low. Yesterday’s CPI did not change that.
SMH hit the first scenario level on a closing basis, correlation popped, and breadth did not roll over.
That combination has marked lows, not tops.
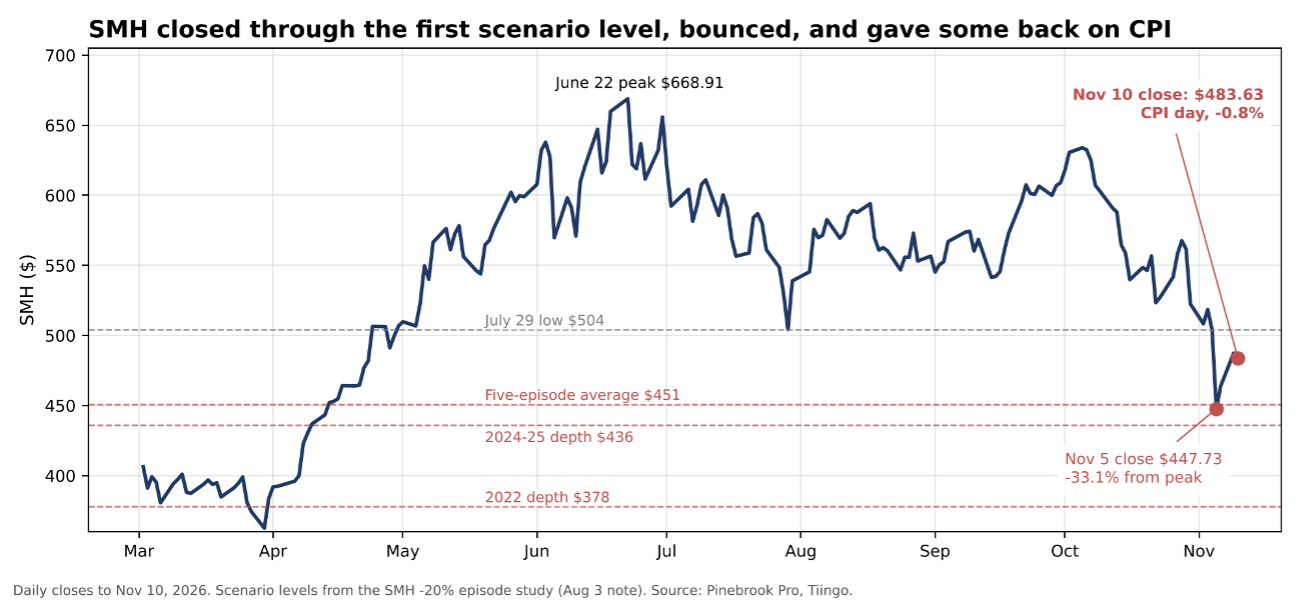

Split-adjusted daily closes, 2009 to Nov 10, 2026; ranked by depth. Nov 10 close: $483.63, +8.0% from the Nov 5 low, ‑27.7% from the peak. SMH data starts 2009, so this table excludes the 2000–02 and 2008 bear markets; the SOX table below covers them. On adjusted closes the 2015–25 average depth (‑33.1%) implies $448 from the June peak; the series has used $451. Source: Pinebrook Pro.
Depth: average. The Nov 5 close ranks 4th of 7, level with 2020 and exactly at the 2015–25 average. It is already deeper than 2018 (‑27%), the credit-driven analog. If this follows 2018, the risk is time, not depth.
Time: in the middle. At 96 trading days it is longer than the quick flushes (2011, 2015, 2020) and about half the slow grinds (2018, 2022, 2024–25), which ran ~190–200 days. The slow ones came with Fed tightening or credit stress. This one now has Fed tightening.
After the trough. Every prior trough was followed by gains of +19% to +60% over three months. Only 2022 went meaningfully deeper; that is the $378 scenario, another ‑16% from the Nov 5 close.
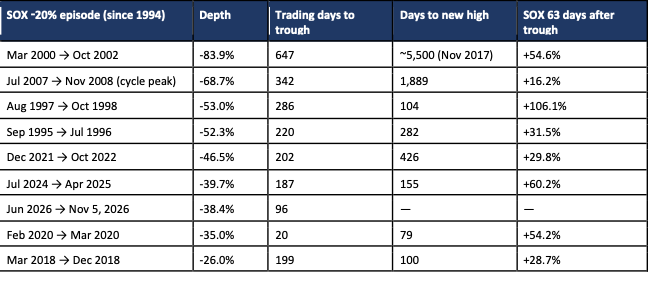
PHLX Semiconductor Index, daily closes May 1994 to Nov 10, 2026; peaks are record highs except 2007 (cycle high). Ranked by depth. Source: Bloomberg.
The long history is less kind. On the SOX the drawdown is ‑38.4%, 7th of 9 since 1994: deeper than 2018 and 2020. Two of the deeper ones, 2000 and 2008, were bear markets measured in years.
The 2000 analog: late summer 2000. AI peaked in June; five months on is August 2000. From the March 10, 2000 peak the SOX fell 35% to its May 23 low, rallied 46% to within 5% of the high by June 21, and was down only 16.1% on August 30. The 84% leg came after. The Fed hiked into May 2000, cut in January 2001, and high-yield spreads widened all year. Today the SOX is ‑32% (‑38% at the Nov 5 low), deeper than 2000 at the same stage, but credit is tightening. If credit turns, 2000 becomes the base case.
Volatility regime. The market has moved from fear of missing the upside to fear of the downside. A low here comes with higher volatility and a lower multiple, not a straight run back to the June highs.
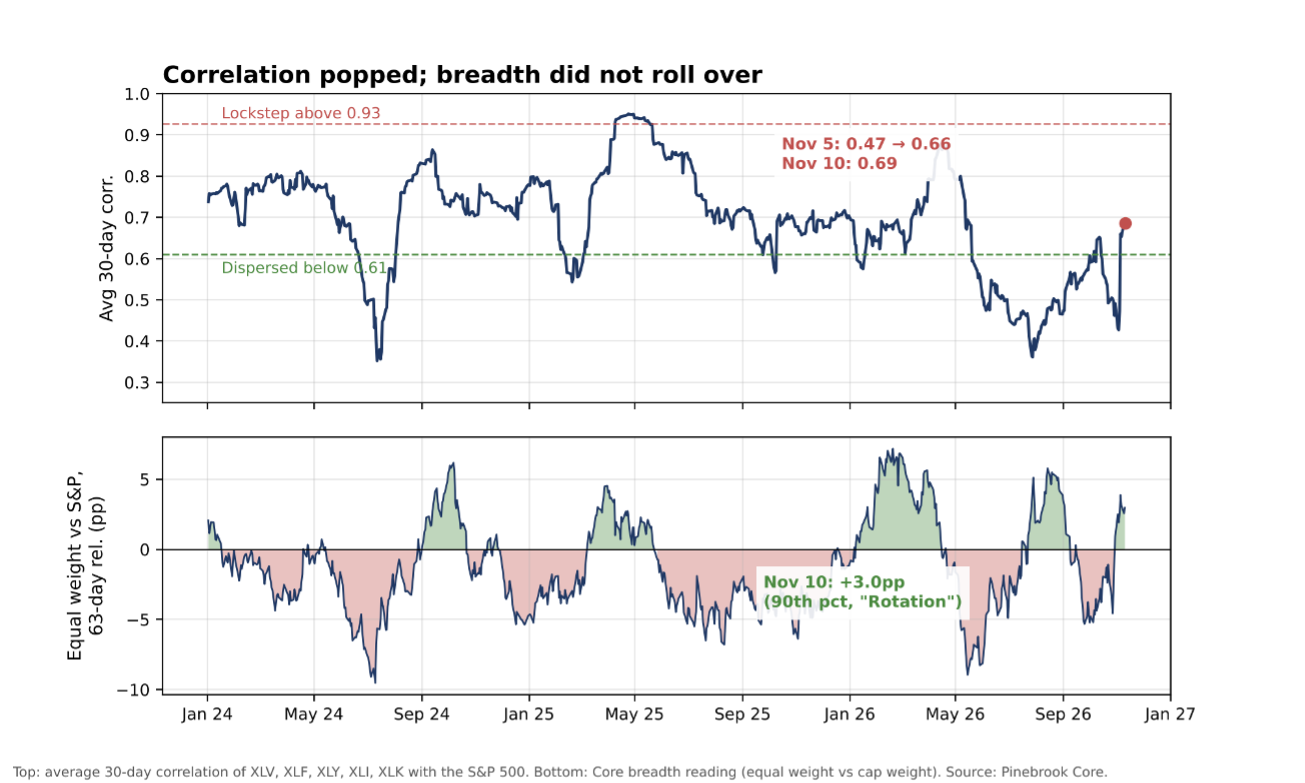
Correlation pop. November 5th’s jump (0.47 to 0.66) was the second-largest since 1999 on the final close (+0.19), behind only October 10th, 2018 (+0.21), the closest analog to the 2018 path. It was 0.69 at Tuesday’s close: still elevated, as a 30-day window should be. In five of six comparable pops since 2009, SPY was higher three months later.
Breadth is the test. Equal weight leads the S&P by 3.0pp over 63 days (90th percentile, Tuesday’s close); the lead widened on CPI day. In 2018, breadth rolled over with correlation. That has not happened here.
Valuation has already done heavy lifting. Investors already cut the multiples while analysts drag their feet to cut the estimates. That is the next cockroach to watch out for.

Sources: Yardeni Research (Nov 5–8).
The US pullback is likely over. Equities, breadth, labor and valuation all say flush, not top. Credit healed into the CPI print, and the hot print did not break it.
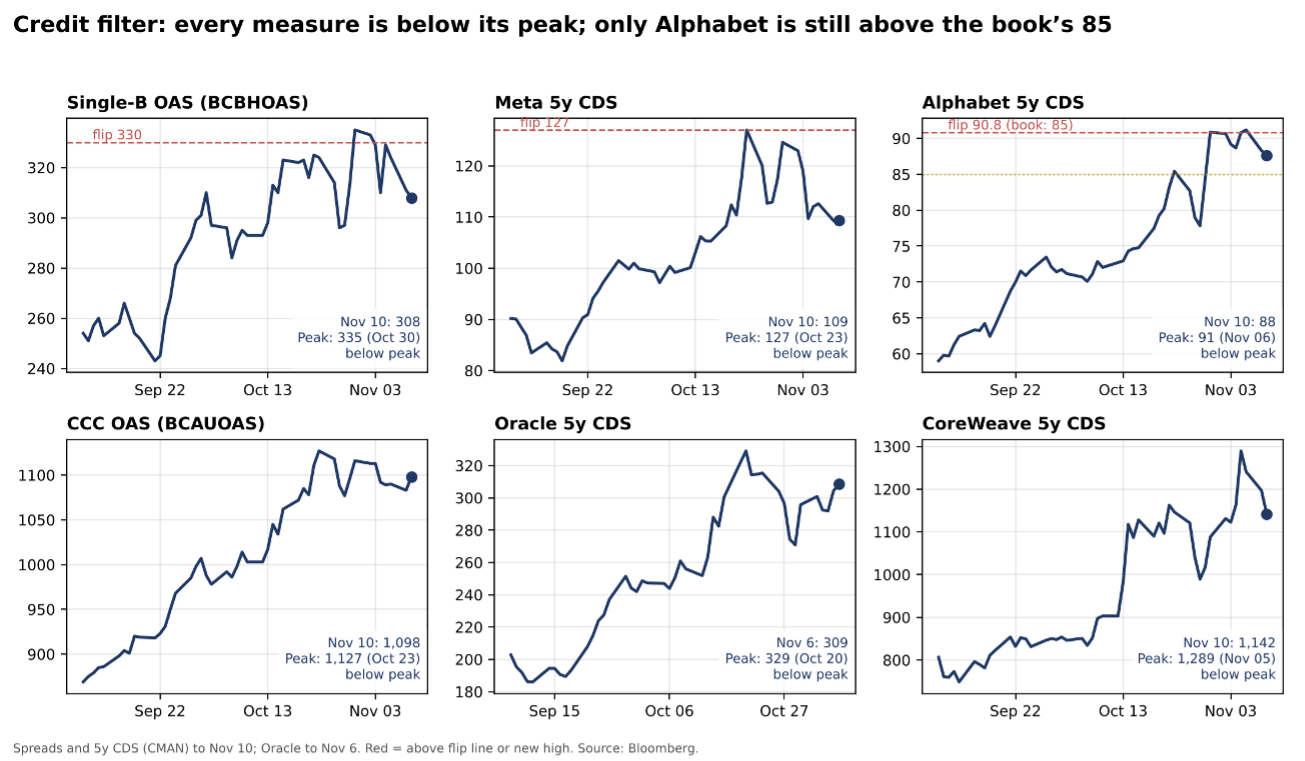
Credit spreads, breadth, and priced rate paths versus actual inflation are the signal. Credit is the tell, and it healed. Every AI credit measure is below its peak.
Single-B tightened again on a hot CPI. Single-B closed Tuesday at 308bp (‑16bp since Friday, 27bp inside its peak).
CoreWeave’s CDS eased 147bp before it beat and raised. Currently, 5y CDS 1,142bp (‑147bp from its Nov 5 high). Q3 revenue $3.66bn against $3.56bn expected, 2026 revenue guidance $13.0–13.3bn, about $9bn of customer prepayments due next quarter.
CCC widening 15bp on CPI day is the one blemish. But CCC follows a FILO (first in, last out) path where stress shows there first and is the last area of the spectrum to heal.
The Fed is the new area of stress
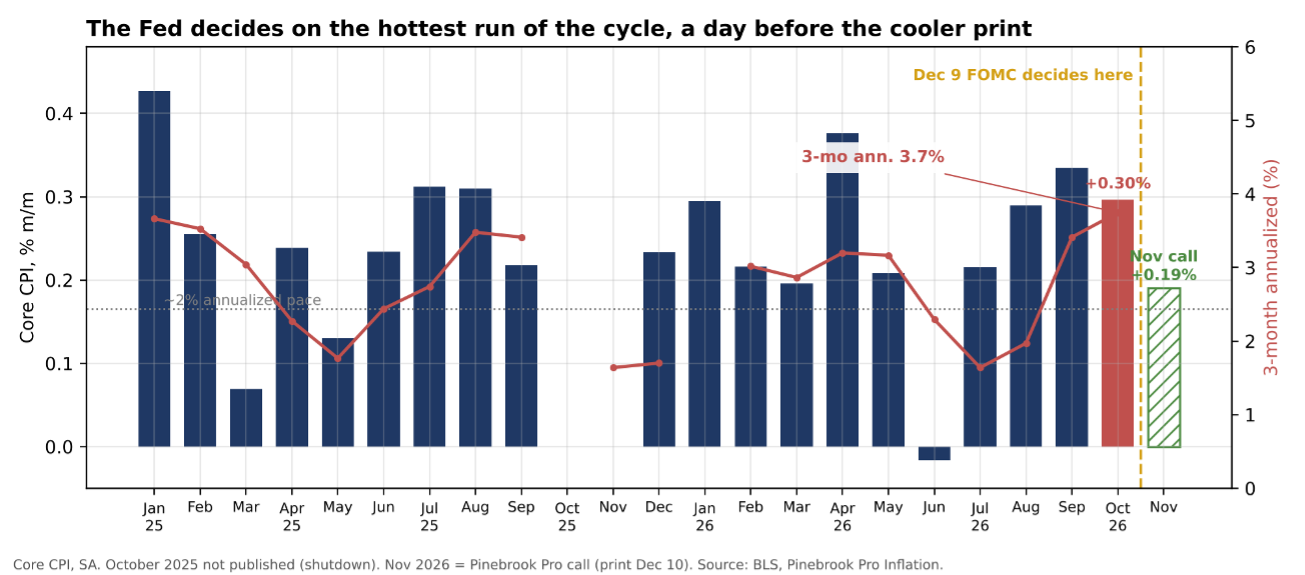
The economy is not the problem. Inflation is broad, and on December 9th, the Fed will act on the hottest run of the cycle a day before a potentially cooler print.
Pinebrook’s preliminary November CPI projections are .1% MoM for headline and .19% MoM for core, released on December 10th, a day after the December FOMC meeting.
For reference the Cleveland Fed is at .14% for headline and .21% for core for November CPI.
Pinebrook vs. the Cleveland Fed is irrelevant as both will round to .1% and .2%, respectively.
What is relevant is the risk of an overly hawkish Fed right at the moment of an inflection into lower inflation prints.
You cannot make this shit up. 😂🤦🏻♂️
That sets up a policy-mistake trade, not a recession trade. A policy mistake need not be a cycle killer, provided the Fed can pivot in time.

Pinebrook Pro calls are timestamped and scored against the print. Source: Pinebrook Pro Inflation, Cleveland Fed.
Base case for December is still 25bps, with risks for 50bps.
January is live, and three more hikes are likelier than two.
Longer out, the key question for the cycle is this: can the Fed engineer ANOTHER soft landing from an inflation peak given a capex boom this size, which is increasingly debt driven.
Coming out of the 2022/2023 hiking cycle, the Fed did not have to contend with a capex boom super cycle. Then, the economy was recovering from the Covid and Ukraine war supply shocks in the context of WWII-sized fiscal deficits.
In November of 2023, these pages determined that the Sand Has Shifted when the Fed’s pain point was identified as an intersection of then-current declining inflation paired off against forward-rising unemployment.
“The purpose of this exercise is to draw attention to and understand the pain points where the Fed would most likely make its next policy pivot, and the time frames involved in doing so.
Under these simulations, any 4.1% U3 reading becomes potentially recessionary.
This is not to say the U3 rate cannot reach the Fed’s stated 4.3% level without triggering a recession. It just has to happen at slow rate and likely not in H1 2024.
So that it can front run a Sahm Rule recessionary trigger, the Fed likely becomes inclined to pivot to cuts in Q2 2024 if the U3 unemployment begins to increase past 4.1% between now and the end of Q1 2024”.
Two weeks later, the soft landing was called, and a few weeks later the Fed pivoted.
Today, we can use the same framework to determine the pain points, the pivot, and the cyclical result.
Let’s get after it.