
Signal & Noise Filter
Cruel Summer

The last Signal & Noise Filter ended without concluding remarks. That was deliberate.
The implication was clear enough. Come back when the data has done more work. Three buckets were laid out, the third explicitly labeled early, and the note closed with a provocation rather than a summary: the margin in a dislocated oil market is not in the molecule — it is in the ability to move it.
Three weeks on, the data has done considerable work. It is time to score the map.
Bucket one was the simplest call: AI is real, the capex cycle is real, the earnings power is real, and the market is correct to assign premium valuations to companies that sit at the center of that buildout. History has shown repeatedly that technological cycles are underappreciated on the way up.
The Q1 earnings season has now validated that framework with a forcefulness that has surprised even the bulls. Eighty-four percent of S&P 500 companies have beaten consensus earnings estimates — better than the one-, five-, and ten-year averages of 79, 78, and 76 percent, respectively. Net margins have officially reached a record 13.4 percent.
The market was not wrong to own the AI supply chain. Instead, it may have been insufficiently aggressive about it.
Bucket two was the energy call: the dip in XLE and OIH was a buying opportunity, not a warning. The physical system does not reset when a ceasefire is announced. Infrastructure damage, insurance repricing, shipping route disruption, and the arithmetic of rebuilding a global inventory deficit measured in billions of barrels do not resolve on a diplomatic timeline.
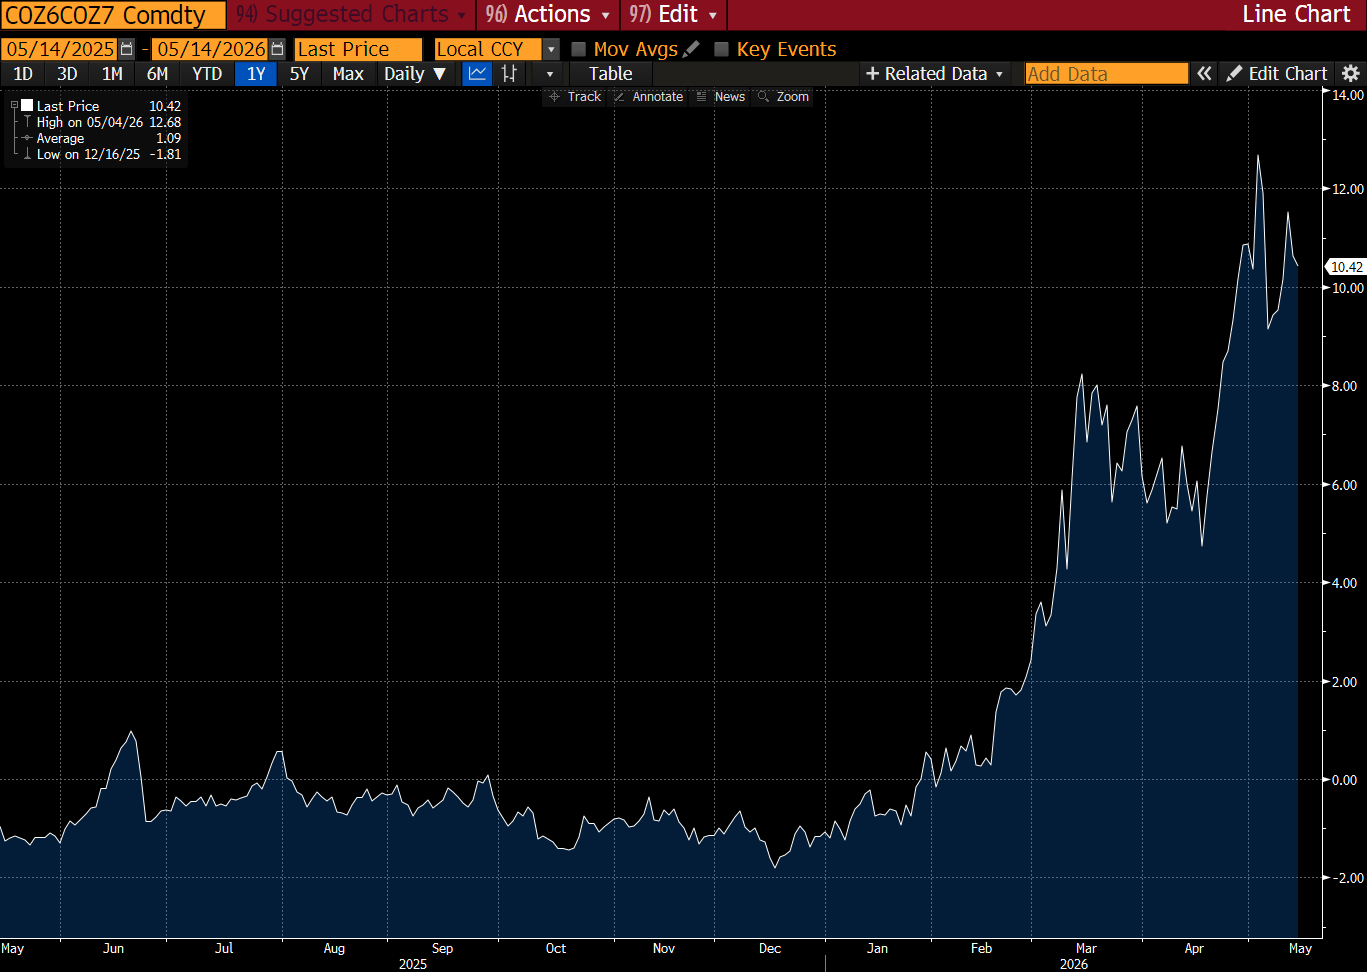
Pinebrook established positions in XLE and OIH on May 5th. Those positions are modestly underwater as of this writing. The COZ6/COZ7 spread — the instrument identified in the April 8th Destiny note as the monitoring signal for physical tightness — is at 10.42, slightly off its prior high of 12.68 on May 4th. The old March 19th peak of 9.43 is in the rear-view mirror.
Bucket three was the least obvious and the most interesting: the dislocation is not simply that oil is scarce, but that it is geographically mismatched. Value accrues not just to the producer but to the system that re-routes, stores, balances, and delivers.
The market has confirmed buckets one and two in price and is beginning to sniff bucket three. This note advances the framework to the next question: what does the forward path look like from here, and how does the evolution of Fed policy reshape the probability distribution for every asset class?
In trying to find a signal, an appropriate starting point is often identifying, then discarding, the noise. The noise in this case is last week’s headline numbers in the Jobs Day employment report.
The signal is in the labor market’s immunity to recessionary pressure, which was flagged in January, when Initial Claims were running near 210,000.
Three months and one geopolitical oil shock later, the 4-week Claims average stands at 203,750 and near multi-year lows.
Continuing Claims have fallen to 1,782,000, the lowest reading since April 2024.
We are now deep enough into the window when companies might have begun layoffs in response to an oil shock of this magnitude. That has not happened.
This is the fourth consecutive month in which the street’s recession anchoring has caused it to underestimate the resilience of the American labor market.
What the jobs report does not do is provide any rationale for Fed easing.
The employment picture has one important nuance the headlines obscure. The ECI breakdown from the April 30th release told the deeper story: wages and salaries grew +0.7 percent quarter-over-quarter while benefit costs grew +1.3 percent — benefits growing at nearly double the rate of wages.
Healthcare benefits specifically are up 5.7% YoY. Individual market benchmark silver plan premiums increased 21.7% in 2026. The mechanism is precise and the policy implication unambiguous.
Rising employer-sponsored insurance costs suppress wages without raising take-home pay. Compensation costs increase, but the increase accrues to insurance companies and healthcare providers — not to worker paychecks.
Tuesday morning’s CPI prints added further anxious noise to the labor market picture. Deflating wages by CPI removes a year of nominal wage gains.
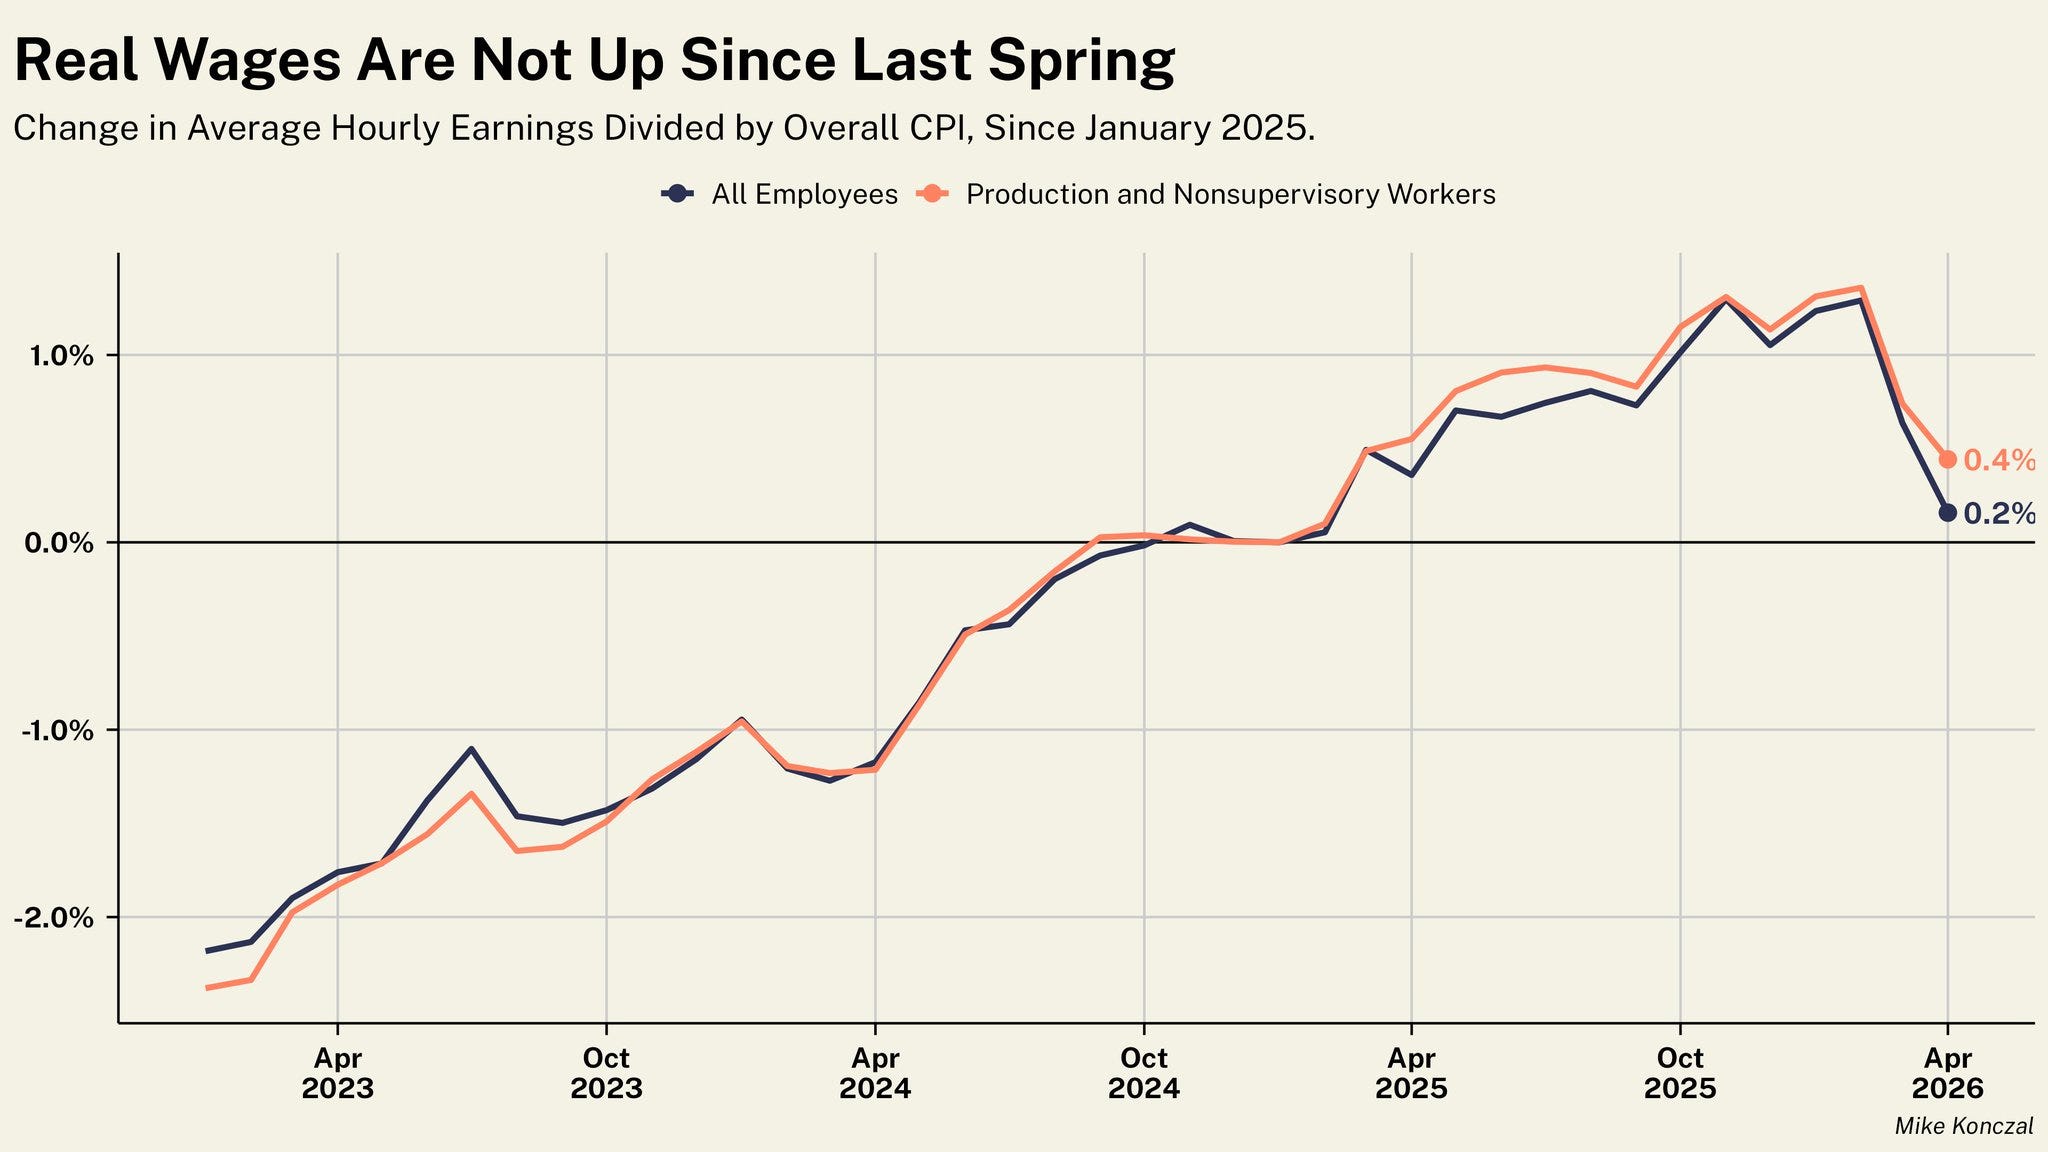
While Mike Konczal, whose chart appears above, is a Pinebrook friendly, we cannot let him have all the chart fun. Below is a chart of indexed wages of non-supervisory workers (the W2 proletarians who do not receive management bonuses or stock option-based compensation) deflated by CPI.
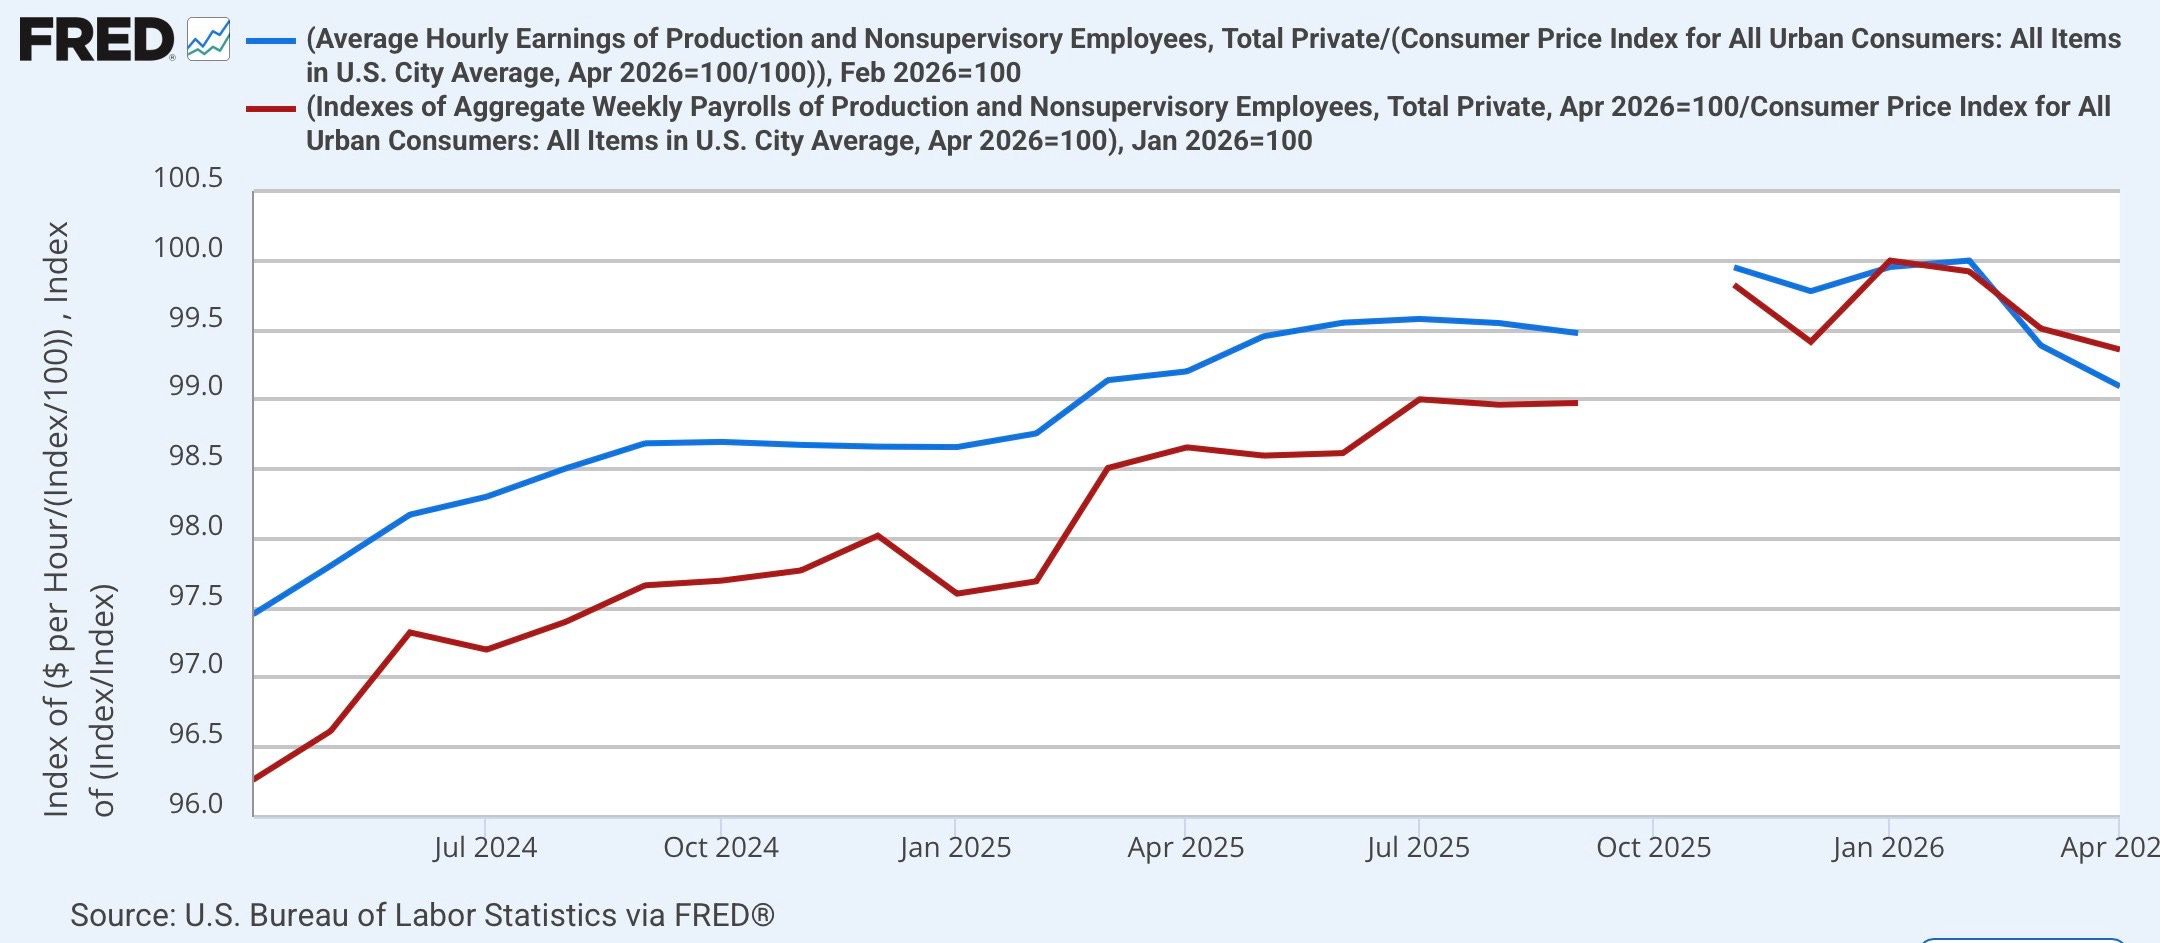
Real wages are down -0.9% from their peak.
Real aggregate weekly payrolls are down -0.4%
In a normal world, both measures of real wages and weekly payrolls would be sending a yellow recessionary flag, and today’s consensus will take it as such.
We are not in a normal world.
Market participants should look forward. As with Pinebrook’s February forward call of an inflationary growth pick-up, and confirmation of the restocking cycle, aided by a gargantuan AI Capex spend, signs of a reaccelerating labor market are manifesting themselves.