
Market Commentary
Destiny in New Rochelle, New York


Preamble
The equilibrium price for physical Brent oil is not determined by futures curves on a screen. It is determined by the price that ensures the last marginal barrel arrives where it is needed, when it is needed, and that enough demand disappears to make that possible.
This note outlines the structural dislocation currently unfolding in global oil markets, driven by the closure of the Strait of Hormuz and the resulting breakdown in logistics, inventory buffers, and product markets.
A temporary ceasefire among the aggravated parties in the Middle East does not change how physical Brent is priced. It may change timing, sequencing, or levels. But the mechanics remain the same.
The temporary ceasefire makes this note more relevant, not less. It does not change the mechanics of physical pricing - only the timing and sequencing.
Introduction
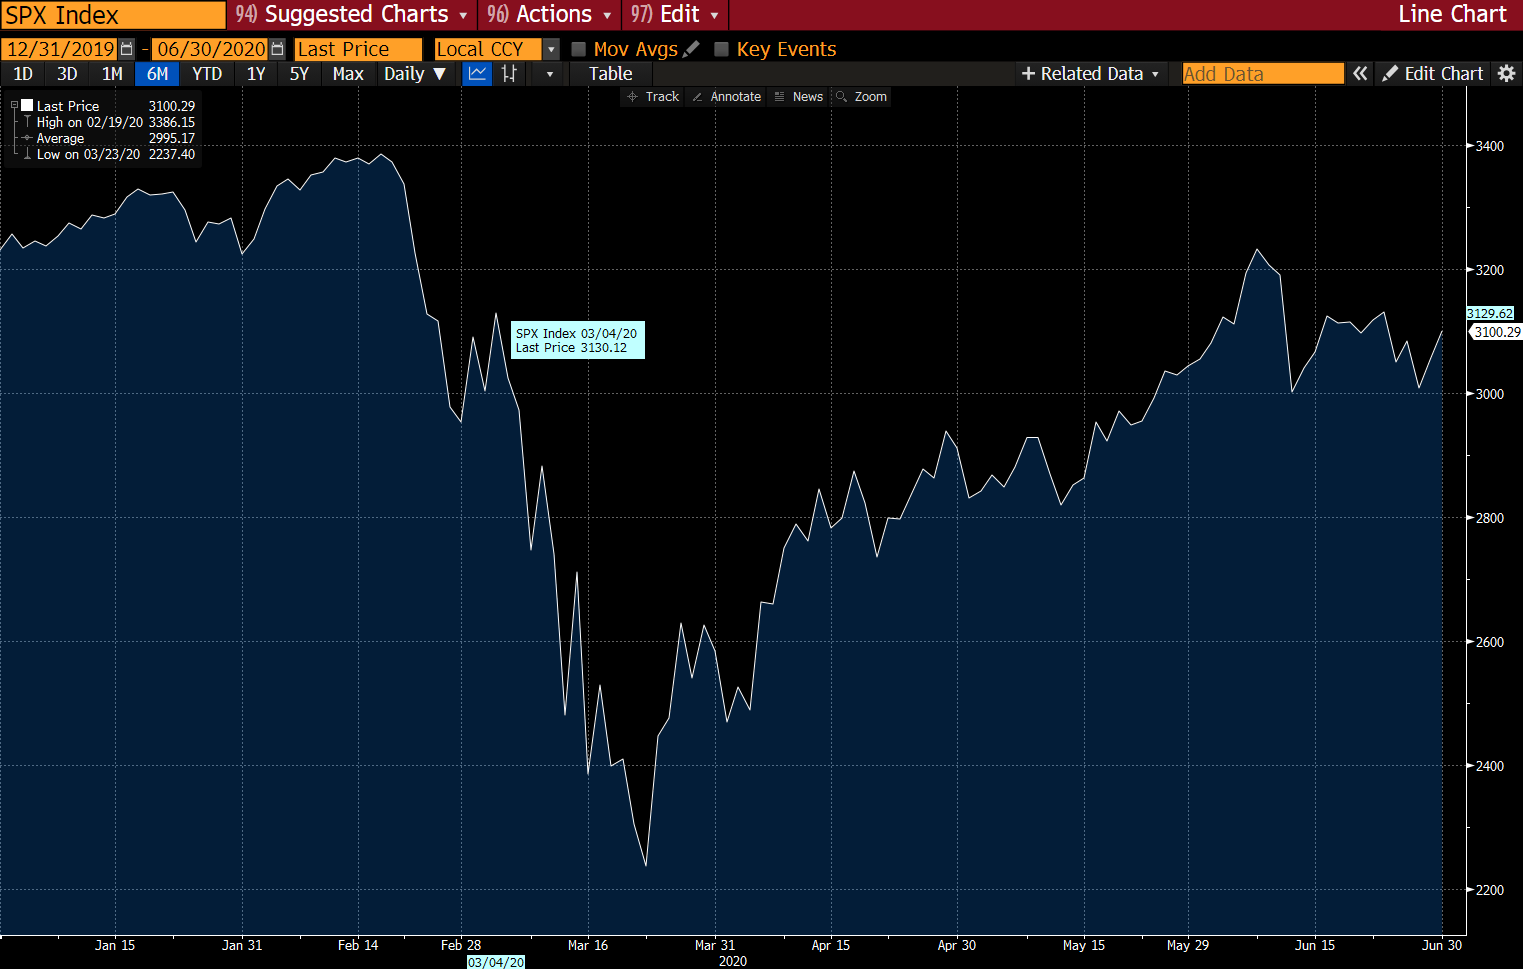
In the halcyon days of November 2019, those who were paying attention started hearing rumors about a mysterious virus that was getting people sick in China. Reports trickled in about the city of Wuhan being shut down, and about a collapse of its medical care delivery system.
The Chinese government came clean on December 31, 2019, when it reported cases of “pneumonia of unknown etiology” to the World Health Organization.
The myth of this being a Chinese problem was smashed on January 20, 2020, by the U.S. Centers for Disease Control when it identified U.S. Patient Zero, a 35-year-old man who flew into Seattle - Tacoma International Airport from Wuhan on January 15th, as the first confirmed case of Covid in the United States.
On February 5th, quarantines started as CDC medical officer teams met planes carrying passengers from Wuhan at military bases across the country. All passengers were placed under mandatory 14-day quarantine orders.
For most people in the United States, it was still business as usual. Schools and other gathering spots remained open, even though the reality of a global pandemic was staring us in right the face as evidenced by mass quarantines on cruise ships.
The containment narrative fell apart on March 2nd, when an attorney infected his synagogue community in the New York City suburb of New Rochelle in Westchester County. Suddenly, it became untenable to deny that the country and the world were not on the precipice of a global pandemic event but rather already knee deep in it.
It was the “oh 💩” moment. And then all hell broke loose, in society and in financial markets.
To these pages, the market narrative appears suspended in the same state of disbelief and denial prior New Rochelle forcing a moment of self-awareness that snapped the market out of its delusion
There are a few things feeding the denial.
Hopes that an early military de-escalation and subsequent durable political solution will emerge that gets oil flowing again through the Strait of Hormuz soon. We are not there yet. ❌
The early-stage nature of the commodity shock which up until now, has not yet caused any shortages, although gas prices are ticking up, especially in California. ✅
As of this morning, roughly 15-hours after the ceasefire, there is no meaningful movement of merchant marine vessels through the Strait. ❌
A ceasefire is a triage solution, but by no means permanent until there is a mutually agreed upon political solution that is durable and enforceable.
Till then, the Strait is risky and unreliable, and the war has made it effectively unusable at scale for the foreseeable future.In addition, the civilian infrastructure in both Iran and Gulf states makes an immediate re-boot unrealistic.
The fog of war is compounded by the internal contradictions and incoherence of President Trump’s wartime strategy. Every day that passes without a political settlement simply compounds the problems that are expected to manifest themselves in the coming days and weeks.
As of today, most tankers that passed through the Strait of Hormuz prior to the war have already made landfall and emptied their oil.
Deliveries to South Asia and East Africa were done by mid-March.
Southeast Asia and Australia were done by the beginning of April last week.
The last VLCC (very large crude carrier) that left before the Iran war is expected to arrive to its destination in a few days.
We now have one month of shortages locked in, as anything departing Hormuz today will not reach its destination for another month, on average.
Ships must enter congested ports, queue for unloading, and cycle through infrastructure that is no longer operating at pre-war efficiency.
This process alone will take weeks, under the perfect assumption that the infrastructure (ports, docks, pumps, refineries, and on and on) can do their job as they did prior to the war. Then there are the human capital losses (i.e., dead people) which degrades institutional knowledge, know-how, and manpower.
Reports of tankers getting through the Strait are noise and should be faded. Not due to their true or untrue factual basis, but because the marginal changes do not move the needle required to re-supply the market in time.
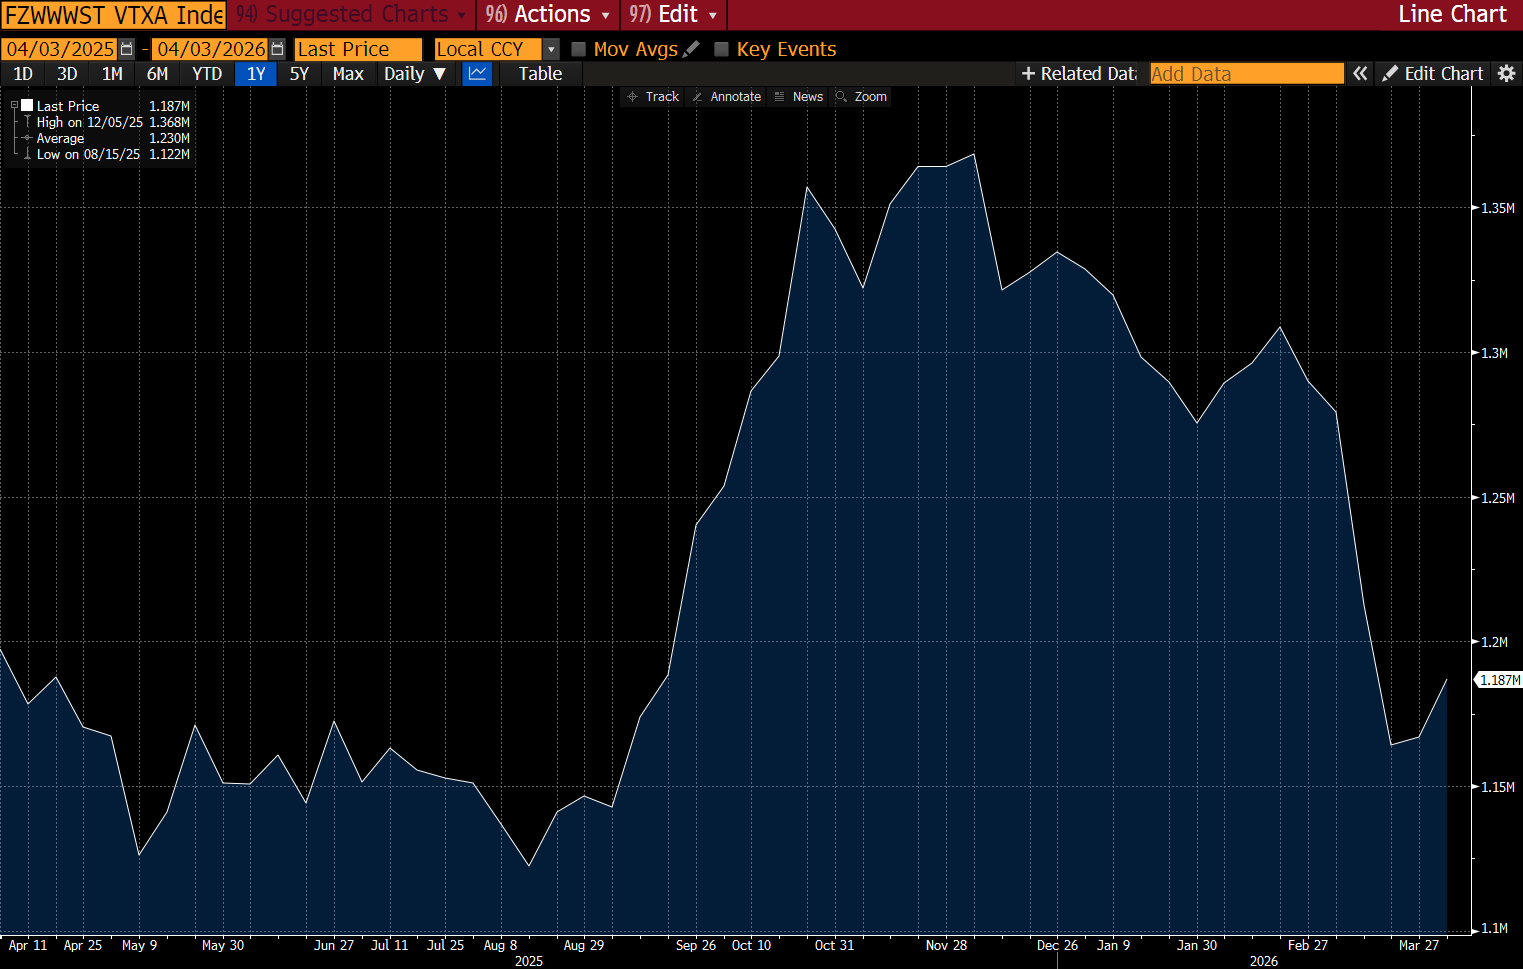
Since March 1st, over 120 tankers have crossed the Strait. Average daily flows are down by 90%, give or take on who is counting the ships (satellites or land-based human intelligence). Below is chart of global crude in transit.
In the desert, the marginal rate of change from one drop of water to five is not going to keep you alive. The global economy is not much different when it comes to oil.
Sitting around counting that next drop isn’t very helpful.
The oil market had large buffers prior to the war, such as floating storage. These are now gone. The inventory math is quite simple and not resolved by a dozen or two tankers getting through the Strait.
Even with the ceasefire, total inventories lost are -1.2 billion barrels by the end of April.
End of May takes us to -1.5 billion.
End of June is -1.8 billion.
H/t @HFI_Research
To remediate these storages, the market will need a surplus of +2 million barrels per day for 600, 750, or 900 days, respectively. The first replacement cargo is still 40-days from northern Europe (35 for sailing and a few days in queue, fill up, and go, assuming everything still works perfectly).
Thus, focusing on the marginal volume of ships and oil passing through the Strait is the wrong framework. After all, we know that some volume level of crude will sneak through, either clandestinely or via a hood winked back-room deal that may or may not involve some palm greasing at the toll booth. La Mordida, in Mexican slang, has a way of getting things done.
Pirates have been doing this for millennia.
Han Solo does it in the future under contract from Jabba the Hutt.
Narco bros are it doing today.
Where there is money to be made at a supply choke point, someone will always risk imprisonment or personal injury to rake in above normal economic profits in an unbalanced market.
What invites piracy is a structurally under-supplied market. Marginal movements of product (spices, intergalactic contraband, or meth and ya-yo) do not represent a path to equilibrium because they lack scale.
Instead, piracy confirms the existence of a structurally undersupplied market that marginal movers cannot bring into balance. After all, a balanced market kills the margin arbitrage that covers the risk of getting killed or arrested.
Therefore, the appropriate framework is not in counting ships or tracking marginal flows. It is solving for the price that will balance future available supply with future demand at time T+X.
Analysis
We start with the premise that the paper market can trade meaningfully lower than the physical one because futures still embed reopening odds, policy intervention, eventual stock draw, short traders that are attempting to front run normalization of the curve, and some eventual mean reversion.
On the other hand, the physical market is priced by the marginal cost of the last barrel available to a refinery that must keep its units running.
Currently, physical barrels are commanding extreme delivered premiums: current physical Brent is at a 150-handle despite the overnight collapse in the paper markets.
The chart below is from yesterday, showing a 144-handle.
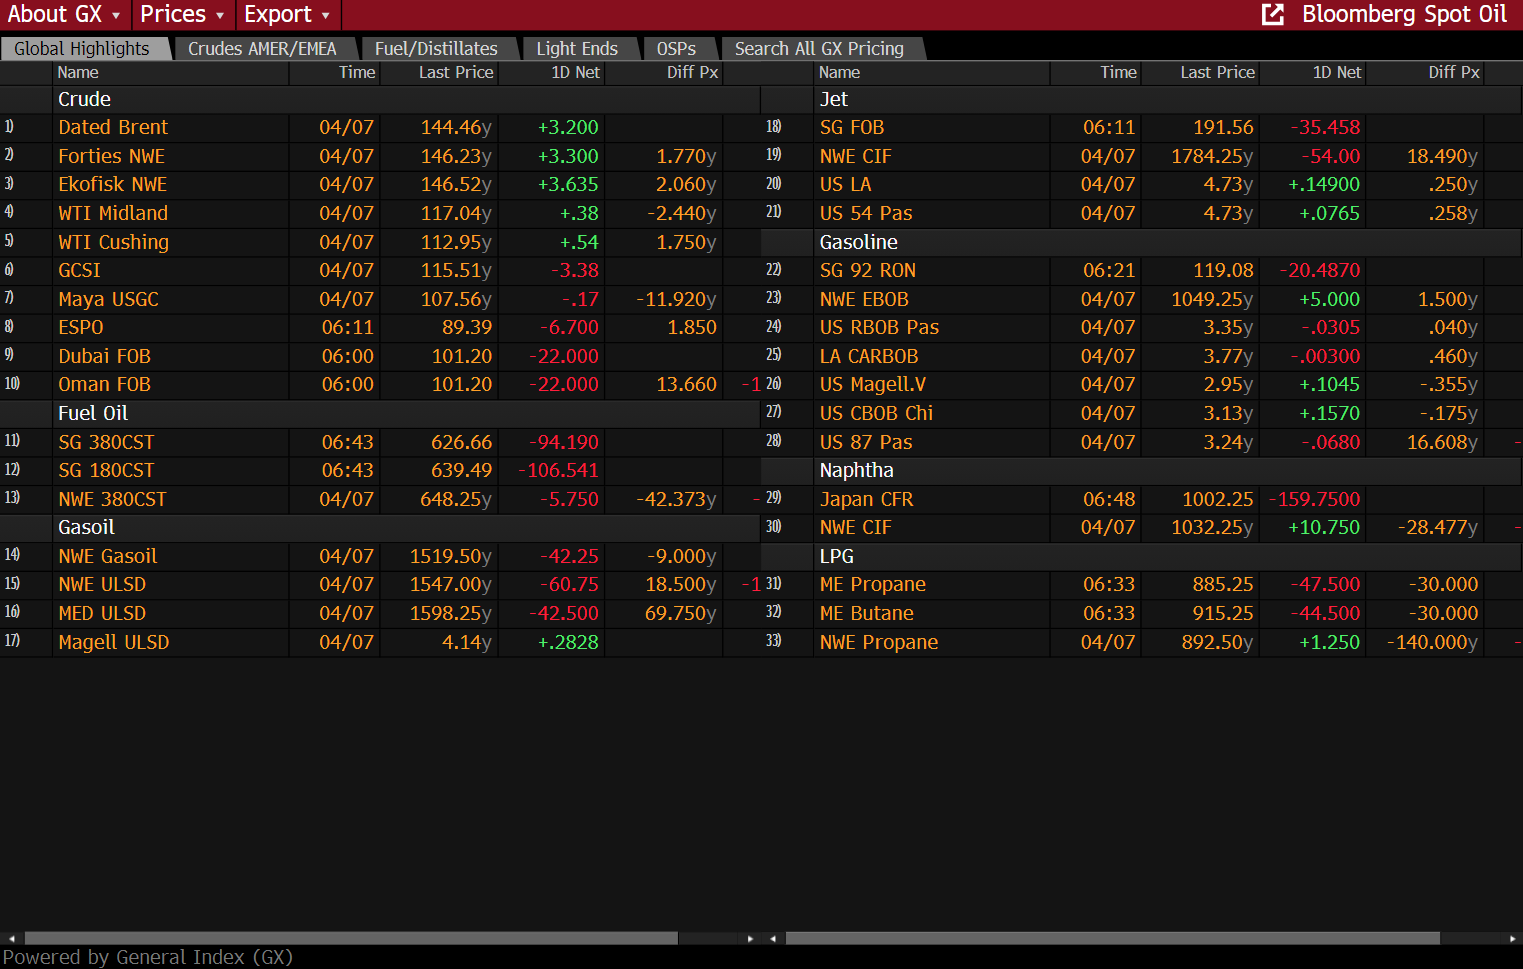
It is higher today despite the ceasefire.
Physical does not care about paper.
Determining the equilibrium price for spot physical Brent during a total closure of the Strait of Hormuz requires isolating the immediate physical deficit from the paper (futures) market.
Based on pre-war global flows and the current 2026 data, here is the first-effort equilibrium analysis:
The Physical Supply-Demand Gap
Before the conflict, approximately 20 million barrels per day (mb/d) of crude and refined products flowed through the Strait, representing about 25% of global seaborne trade.
On the crude side specifically, Saudi Arabia’s 5.5 mb/d represented 38% of Hormuz crude-and-condensate flows, which implies total crude-and-condensate flows through the strait of roughly 14.5 mb/d.
Saudi and the UAE together have only about 2.6 mb/d of pipeline capacity available to bypass Hormuz in a disruption via the Abqaiq-Yanbu (East-West) pipeline in Saudi Arabia and the Habshan-Fujairah pipeline in the UAE.
That distinction is the key one. The headline spare-capacity number looks comforting at first glance: OPEC spare capacity is about 5.3 mb/d, including 3.1 mb/d in Saudi and 1.1 mb/d in the UAE, plus 0.6 mb/d in Iraq and 0.4 mb/d in Kuwait.
That headline is misleading because a chunk of the spare sits in producers whose export routes are still trapped behind the chokepoint.
In other words, paper market participants can point to spare capacity; the physical market only cares about spare capacity that can reach water and eventually customers.
The first-pass physical balance is this:
Gross crude/condensate loss: about 14.5 mb/d.
Less Saudi/UAE bypass headroom: about 2.6 mb/d.
Less fast non-Hormuz response from elsewhere: call it 0.5–1.0 mb/d over a quarter.
Net Physical Deficit: After accounting for pipeline diversions and emergency releases, the market still faces a structural deficit of 11 to 12 mb/d. This does not take into considerations damages to any Gulf infrastructure that won’t come back online for weeks, months, or years.
Refineries in Asia (which take 80% of Hormuz flows) face an existential dry out. To avoid the massive costs of a hard refinery shutdown, these buyers will pay any price for the few barrels still on the water (West African, North Sea, or US WTI).
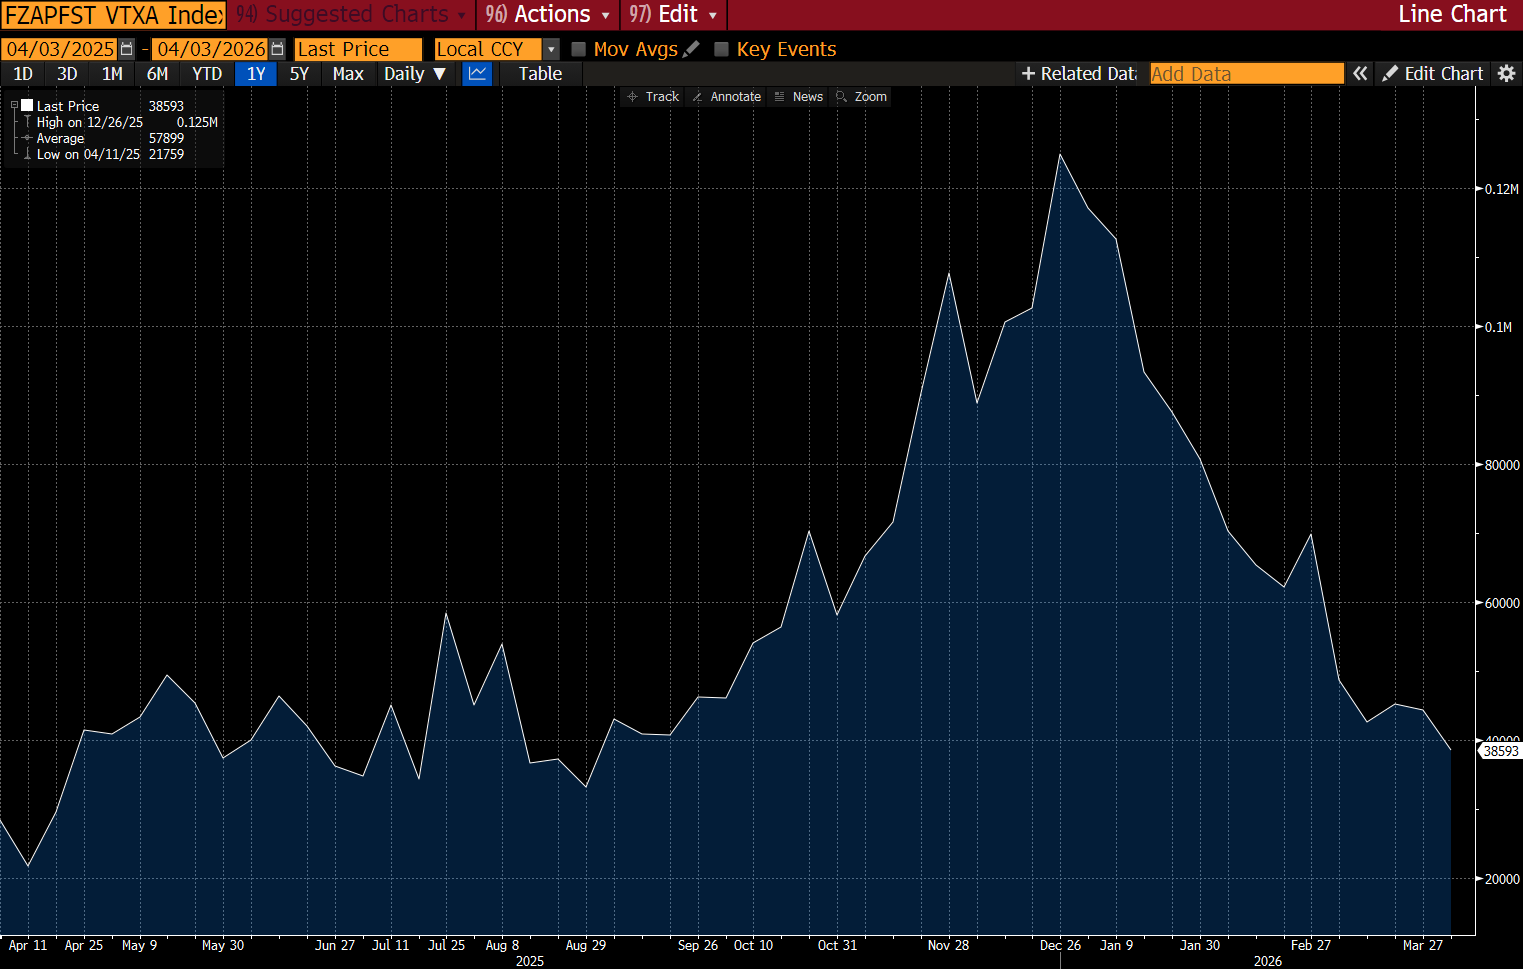
Below is a chart of Asian floating storage, showing a peak to trough drawdown of around 70%.
Other regions show less dramatic but equally concerning drawdowns. The Middle East reveals trapped supply; Europe is not depleted like Asia, but it is also not flush. The U.S. Gulf Coast is acting as a pressure valve, but not a large enough one. The bigger issue is that the system is fragmented, unbalanced, and barrels are not where they are needed when they are needed.
A few days ago, the economist Paul Krugman displayed his toy model here. Unfortunately, he is solving for the wrong answer of global supply versus global demand.
Standard elasticity models like Krugman’s suggest oil prices should rise by 60–70% in response to a disruption of this magnitude. But those models assume a globally integrated market where barrels are instantly fungible.
In a physical dislocation, the relevant elasticity is not global demand elasticity; it is the elasticity of deliverable supply at time T+X.
A barrel that arrives in 40-days does not satisfy today’s price at time T. This creates elasticity collapse, pushing it to the lower end of Krugman’s estimates because the system is fragmented by geography, constrained by transit times, and bottlenecked by distillate production.
The Paper Price Model
Additional information can be found using spread data from live markets instead of egghead toy models.
Mainstream analysis about what is called backwardation in commodity markets, where near prices are higher today than far prices are tomorrow, suggests that markets will normalize in the future. Nothing to worry about.
This would be the inappropriate framing for physical markets.
Below are three price charts of the June 2026, December 2026, and January 2027 Brent futures contracts.
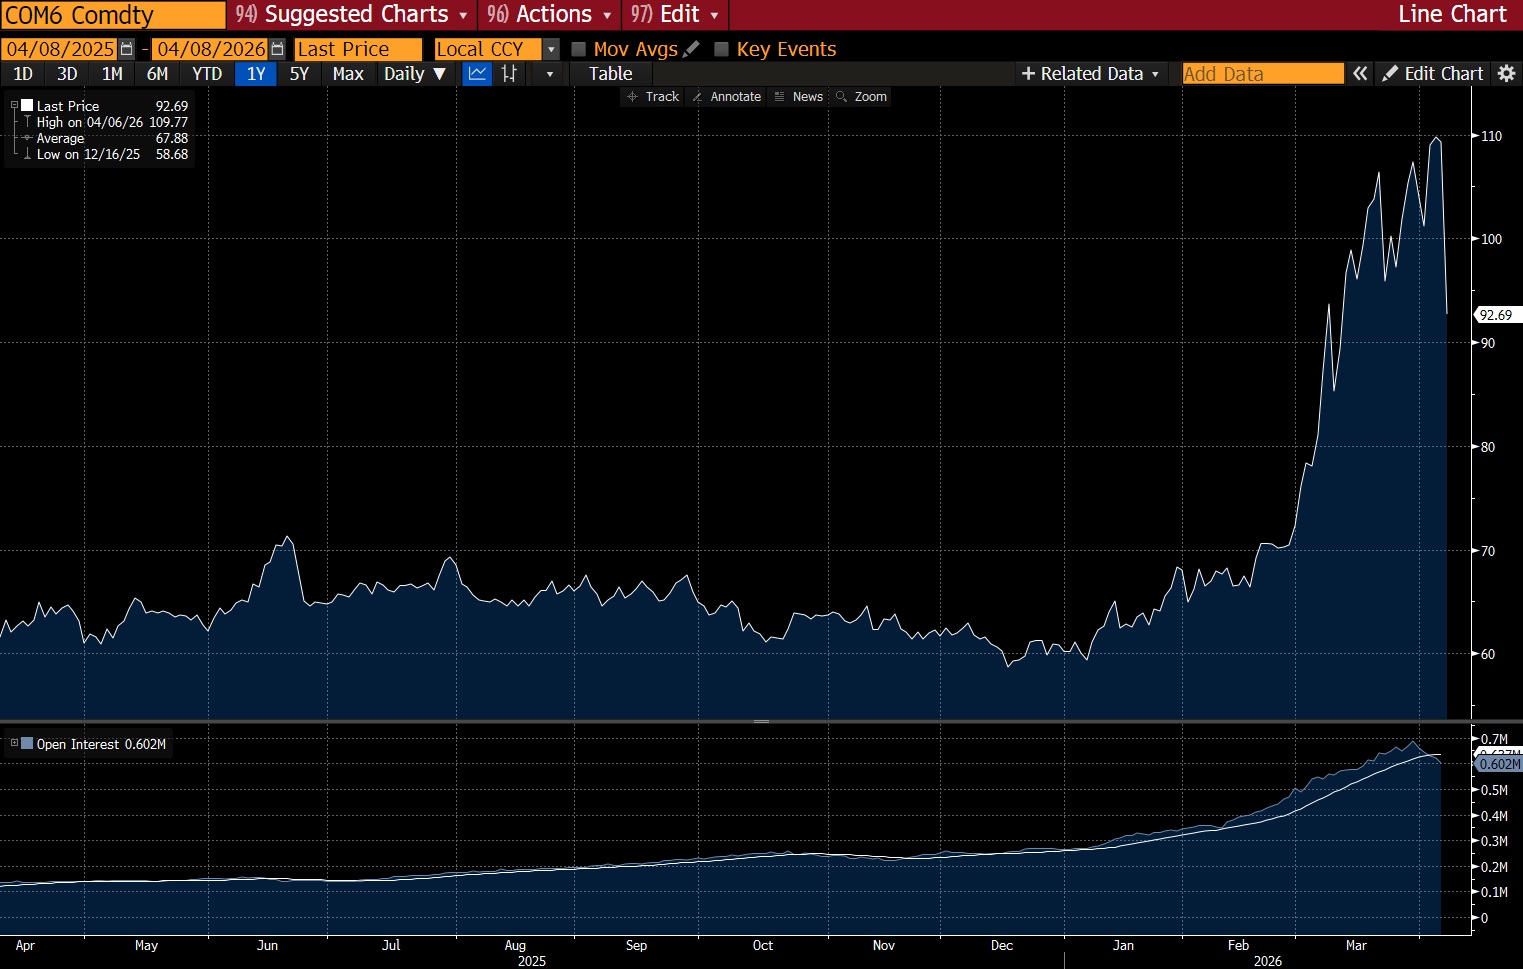
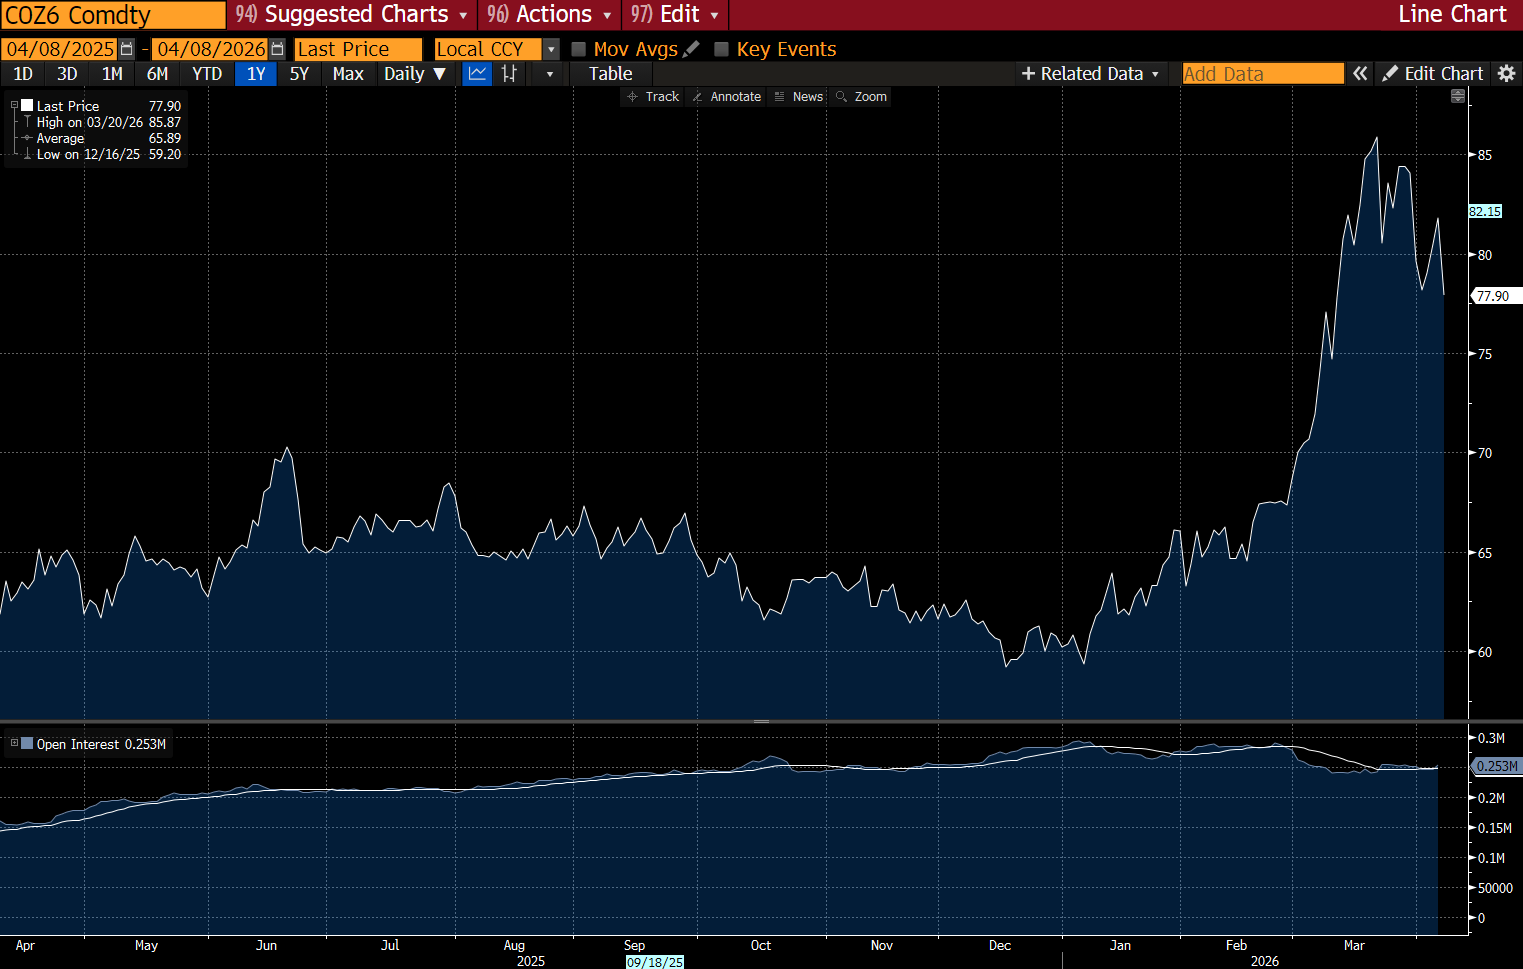
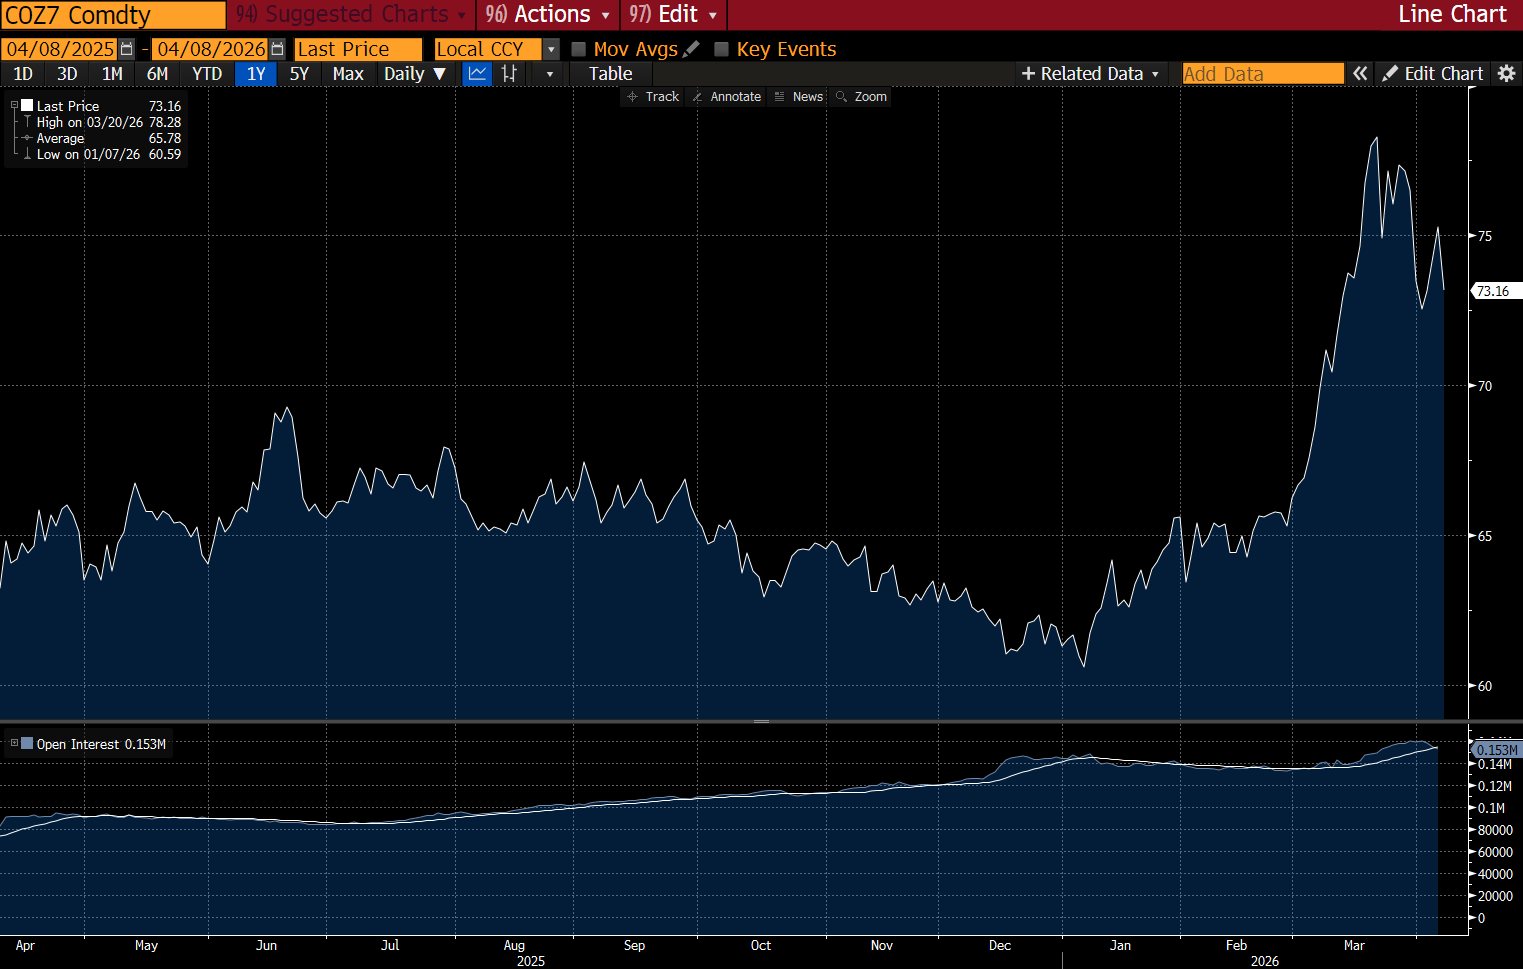
Below is a table that summarizes the spreads among the contracts above between December 31, 2025 (before oil went bananas), April 6, 2026 (the day before the 🌮), and this morning April 8, 2026.
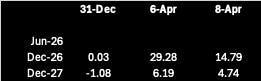
The spreads exploded from near zero or negative at the start of the calendar year until the taco and have given back some of their differentials.
This violent backwardation is a flashing red light indicating that the physical dry-out is hitting the core pricing mechanisms. A barrel in today is worth nearly $10 more than a barrel in June simply because it exists.
None of this is controversial to oil traders. But…and there is always a but…
The Denial is in the Back-End
The December 2026 - December 2027 spread (COZ6COZ7) is only trading at $4.74. This is the evidence of the disbelief mentioned earlier. While the front end is vertical, the back end assumes a rapid “V-shaped” recovery.
It ignores the 900-day refill cycle required to fix the -1.8-billion-barrel hole.
The market is pricing the end of the war, but it is not yet pricing the replenishment of the global tank.
The Inventory Math Conflict: To remediate a June-end loss of 1.8 billion barrels, the market needs a surplus of +2 million barrels per day for 900 days.
Professional forecasts (like the EIA) only project a surplus of 3.0 mb/d starting in 2027 after transit resumes. This means the remediation would take nearly 600 days (until mid-2028) to return to pre-war inventory levels.
The spread between December 2026 and December 2027 is currently too thin. It assumes a rapid return to prewar days that is physically impossible given the current movements and the tank refill requirements that grow by the day.
If the inventory math is correct - that -1.8 billion barrels are gone, then the December 2027 barrel is being vastly underpriced by a market that still hasn’t factored in the 900-day refill cycle required to reach equilibrium.
The Physical Price Model
I model spot physical Brent as a function of the effective shortage that remains after accounting for bypass capacity, non-Hormuz replacement supply, and the shrinking ability of inventories and floating storage to absorb the disruption.
The model is deliberately simple. It starts with a gross net shortfall of roughly 11 mb/d after accounting for Gulf bypass capacity and fast non-Hormuz replacement supply. It then subtracts the market’s shrinking ability to absorb the shock through inventories, floating storage, and rerouting.
This produces an effective shortage of 7.5% of world demand by end-April, 9.0% by end-May, and 10.5% by end-June.
Applying a short-run prompt-market elasticity of 0.06 to a pre-war Brent anchor of $72 yields implied physical clearing levels of $162, $180, and $198, respectively.
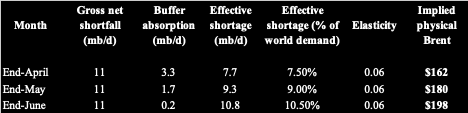
The point estimates are listed on the far-right column above. The range distribution looks like this:
End-April: $155–$170/bbl.
End-May: $170–$190/bbl.
End-June: $185–$210/bbl.
Why the equilibrium rises month by month
By end-April, the market is still living partly off pre-war cargoes already in transit, remaining commercial inventories, floating storage draw, and disbelief. Asia is already visibly depleted on float, and Middle East barrels are increasingly irrelevant to prompt clearing because they are trapped or delayed. Thus, the market must pay enough to pull Atlantic Basin barrels east, preserve refinery incentives, start rationing lower-value demand. That gets you into the low/mid-160s for physical Brent.
By end-May, the problem is no longer interruption risk. It is a realized shortage with cumulative stock draw. At that point, Asia’s buffer is largely gone, West Africa has been leaned on harder, Europe’s modest cushion matters less, North Sea and USGC become the marginal export pools, distillate scarcity becomes more acute.
Thus, the market must pay a higher price to force more aggressive demand destruction, stronger eastward reallocation of Atlantic barrels, continued refinery run maximization despite freight and timing stress. That moves equilibrium into the high-170s / around $180.
By end-June, if Hormuz is still closed, the system is deep into the cumulative deficit phase. This is where the market is no longer just pricing scarcity. It is pricing: depleted usable inventories, chronic distillate stress, shrinking optionality, rising value of prompt cargo timing, and the reality that replacement supply cannot be conjured quickly enough.
At that point, physical Brent must ration demand much more brutally. That is why end - June clearing moves toward $200.
Concluding Remarks
Physical markets are distinct from paper markets.
The normal behavior of paper markets, despite their backwardation, does not reflect the physical reality of the physical Brent dislocation.
Thus, paper markets do not express the gaping hole in physical markets that will continue to grow despite a ceasefire, at least until the aggravated parties come to a durable and enforceable political solution AND results in timely oil flows.
The physical Brent price projections are what they are – projections – which are contingent on multiple unknowable vectors. However, they can serve as a guide to manage expectations of political noise.
In time, physical markets are destiny, as paper markets are legally required to settle at physical spot, not the other way around.
David, truly insightful. Feel grateful to actually have access to such information. I have a quick question. I know that you had gone long or suggested going long emerging markets reading between your tweets last night. If I was to follow the logic in this article, eventually the ETFs representing the south Asian countries should be short opportunities with a 1-3 month hold given that higher oil prices are going to start affecting their economies and their financial markets. What do you think? Am I misreading you? Any other thoughts?
if the analysis based on future px converge to physical spot, why we use brent ( settle in fwd index) rather than wti( settle in physical)?