
Weekly Signal & Noise Filter
The Term Premium Freak Off, Act III: A Fed at War with Itself and a Bond Market Pricing the Fog

INTRODUCTION:
Pinebrook’s 4.60% price target on U.S. nominal 10-year yields was tagged last week on Friday, May 15th.
Price action has accelerated to the upside with yields hitting an intraday high of 4.6853% on Tuesday, May 19th, and the 4.75% secondary yield target has come into view.
Yields have come down modestly on more war resolution jawboning.
This is performative noise.
I. THE FRAMEWORK: WHAT MOVES THE TEN-YEAR
From the NY Fed: “In standard economic theory, yields on Treasury securities are composed of two components: expectations of the future path of short-term Treasury yields and the Treasury term premium.
“The term premium is defined as the compensation that investors require for bearing the risk that interest rates may change over the life of the bond. Since the term premium is not directly observable, it must be estimated”.
The above is the sanitized academic version. These pages dispense with the pretense and offer up a seasoned practitioners take:
The term premium (“TP”) is the animal in the forest no one has ever seen. We assume it exists because we see footprints of the Sasquatch of the fixed income rates complex.
It expands when investors fear the unknown — when the forward path of growth, inflation, and policy is genuinely unclear. It contracts when that fog lifts. The term premium does not respond to realized data. It responds to anticipated data — to what markets believe is coming next.
Thus, the price action in the U.S. 10-year Treasury note is best understood not as a single variable but as the sum of three distinct forces, of which two are directly observable: real rates plus an inflation component, proxied here by the breakeven inflation rate (“BE”).
Reals + BE = Nominal Yields
Breakeven inflation is the market’s pricing of the forward inflation path.
Real rates can be further disaggregated by subtracting the term premium to isolate a real risk-free rate that is free of investor risk preferences and represents the market’s estimate of where real, inflation adjusted, short rates will settle in equilibrium over the life of the note.
The term premium is best conceptualized as the residual compensation investors demand for the uncertainty of holding fixed income duration.
Thus, the above expression becomes:

CURRENT MARKET SNAPSHOT — MAY 20, 2026
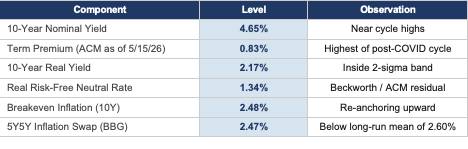
Source: NY Fed ACM Model, Bloomberg FWISUS55. Identity: RRFNR + TP + BEI = Nominal (1.34 + 0.83 + 2.48 = 4.65).
The identity is simple: the real risk-free neutral rate plus term premium plus inflation breakevens equals the nominal yield — but the causal dynamics underneath it are anything but simple.
At 83 basis points as of May 15th, the term premium is near its highest absolute level of the post-pandemic cycle.
The question this note addresses is why — and whether the causal forces driving it have been exhausted or are still building.
II. WHERE WE CAME FROM: THREE EPISODES OF TP EXPANSION
This is the third notable term premium expansion of the post-pandemic cycle. Understanding the first two is essential context for reading the third.
Episode One: August 2020 — March 2021 (+174 bps)
The first expansion ran from negative 137 basis points to positive 35 basis points — 172 basis points in total. Markets were front running what would become realized inflation.
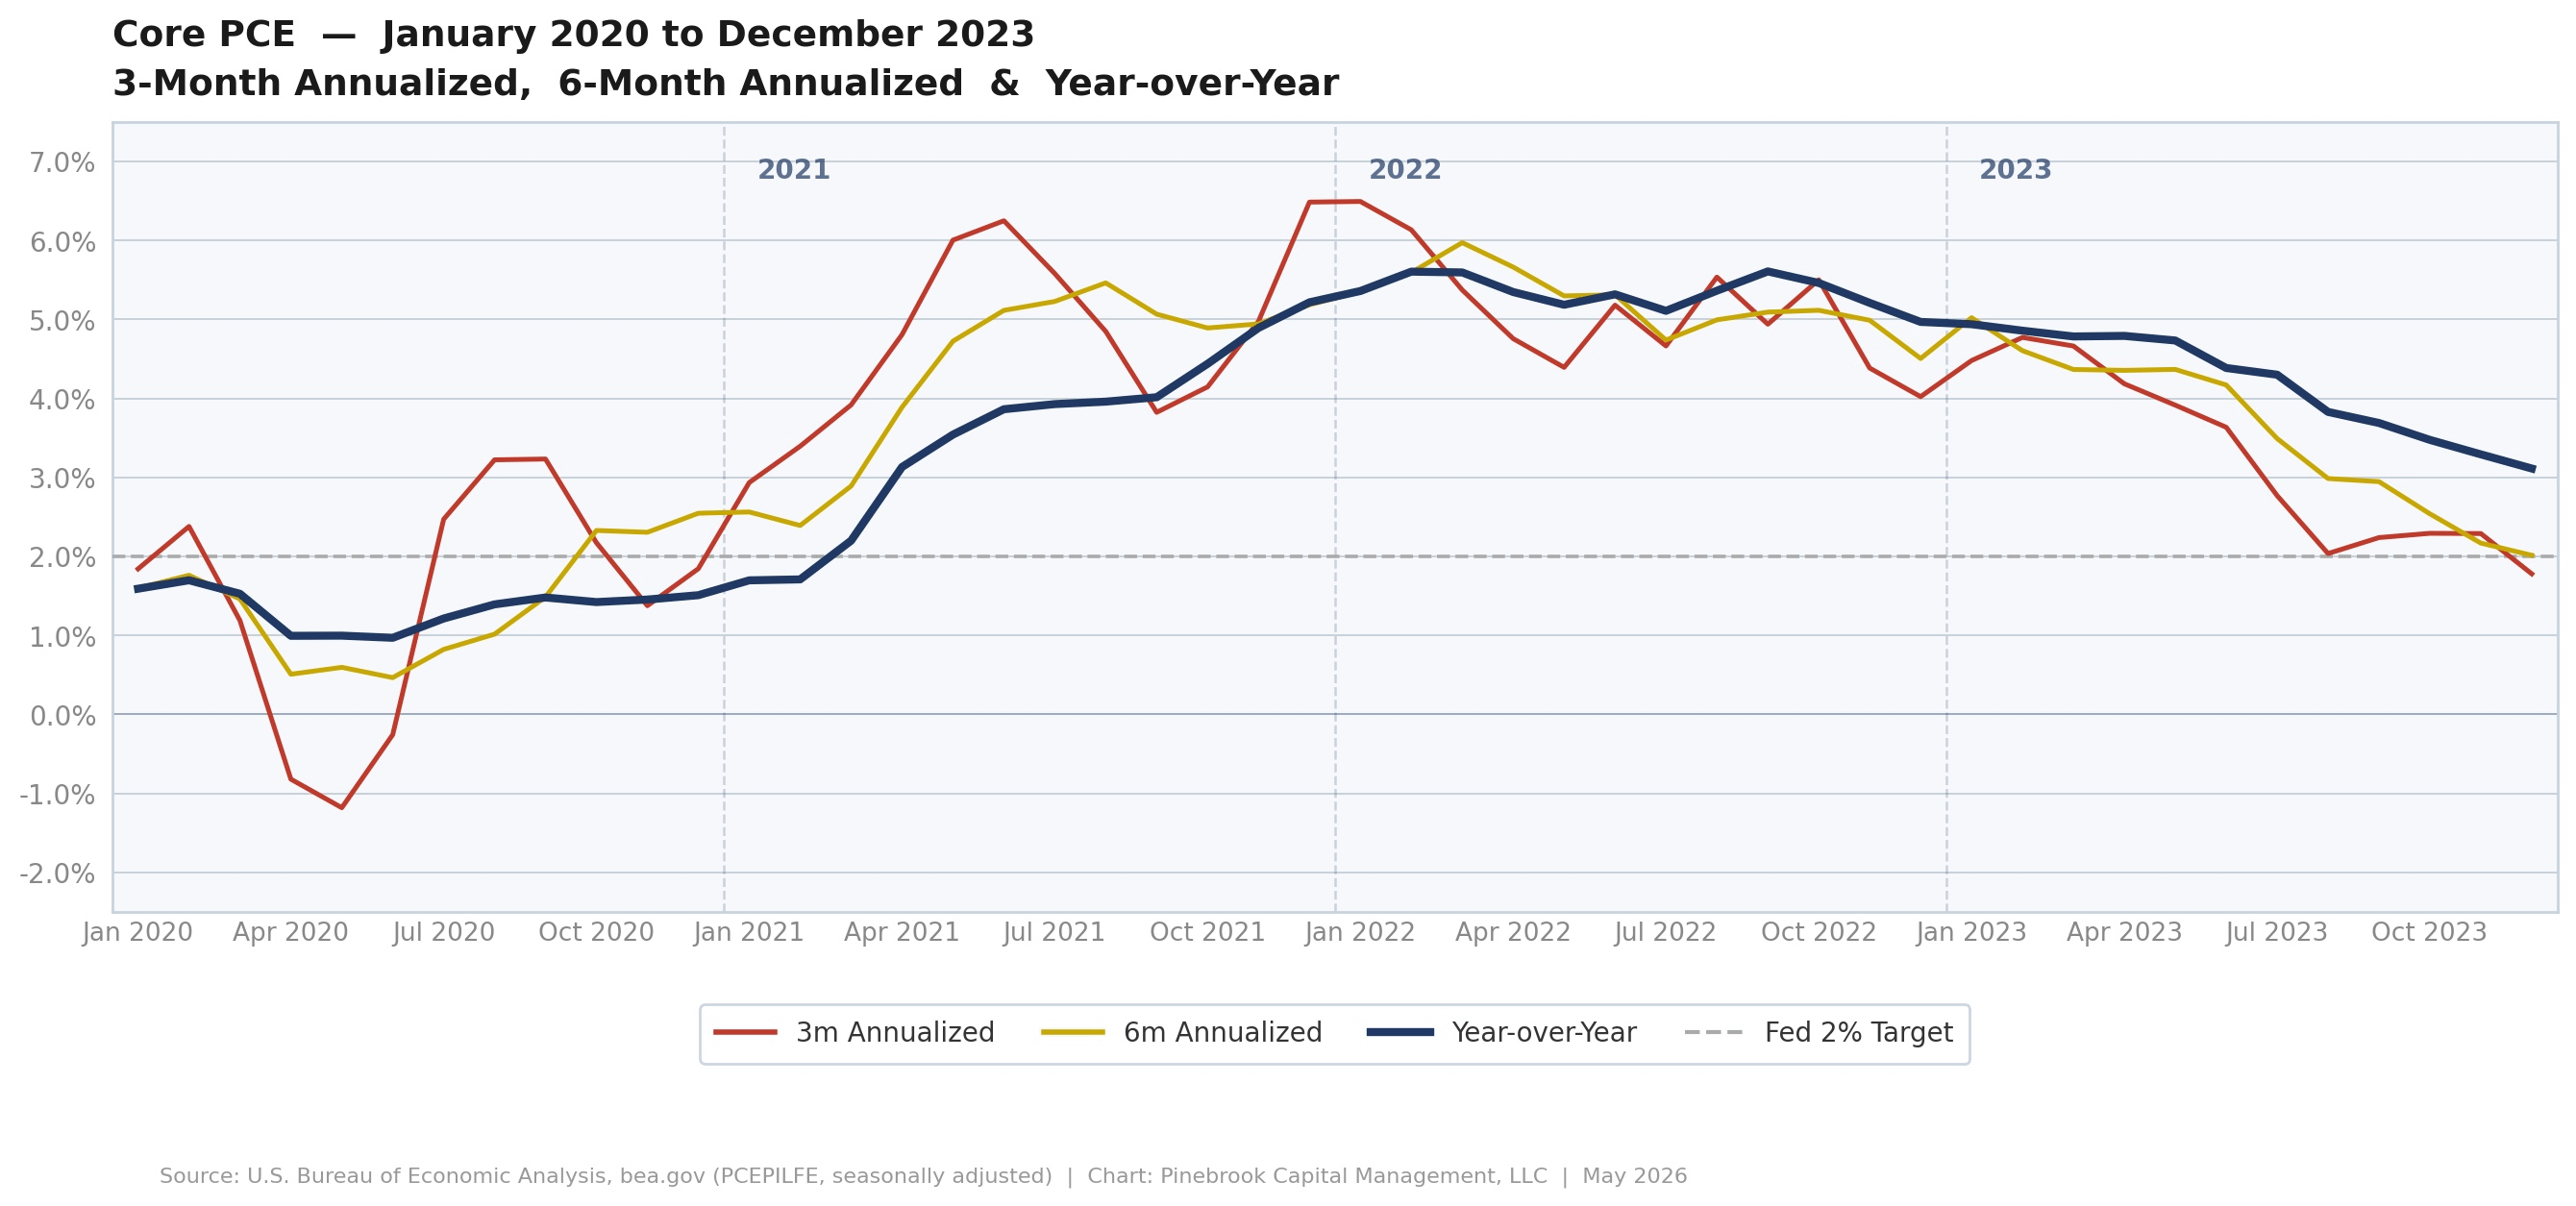
Critically, term premiums peaked in March 2021 even though actual inflation did not peak until February 2022.
Core PCE kept grinding higher for nearly a full year after the TP made its local high.
This apparent paradox — term premiums falling while inflation was still rising — is not a paradox at all.
By the time inflation peaked in February 2022, markets had already priced the Fed’s response.
The 2022 move in nominals was mechanically driven by the hiking campaign, not by term premium expansion.
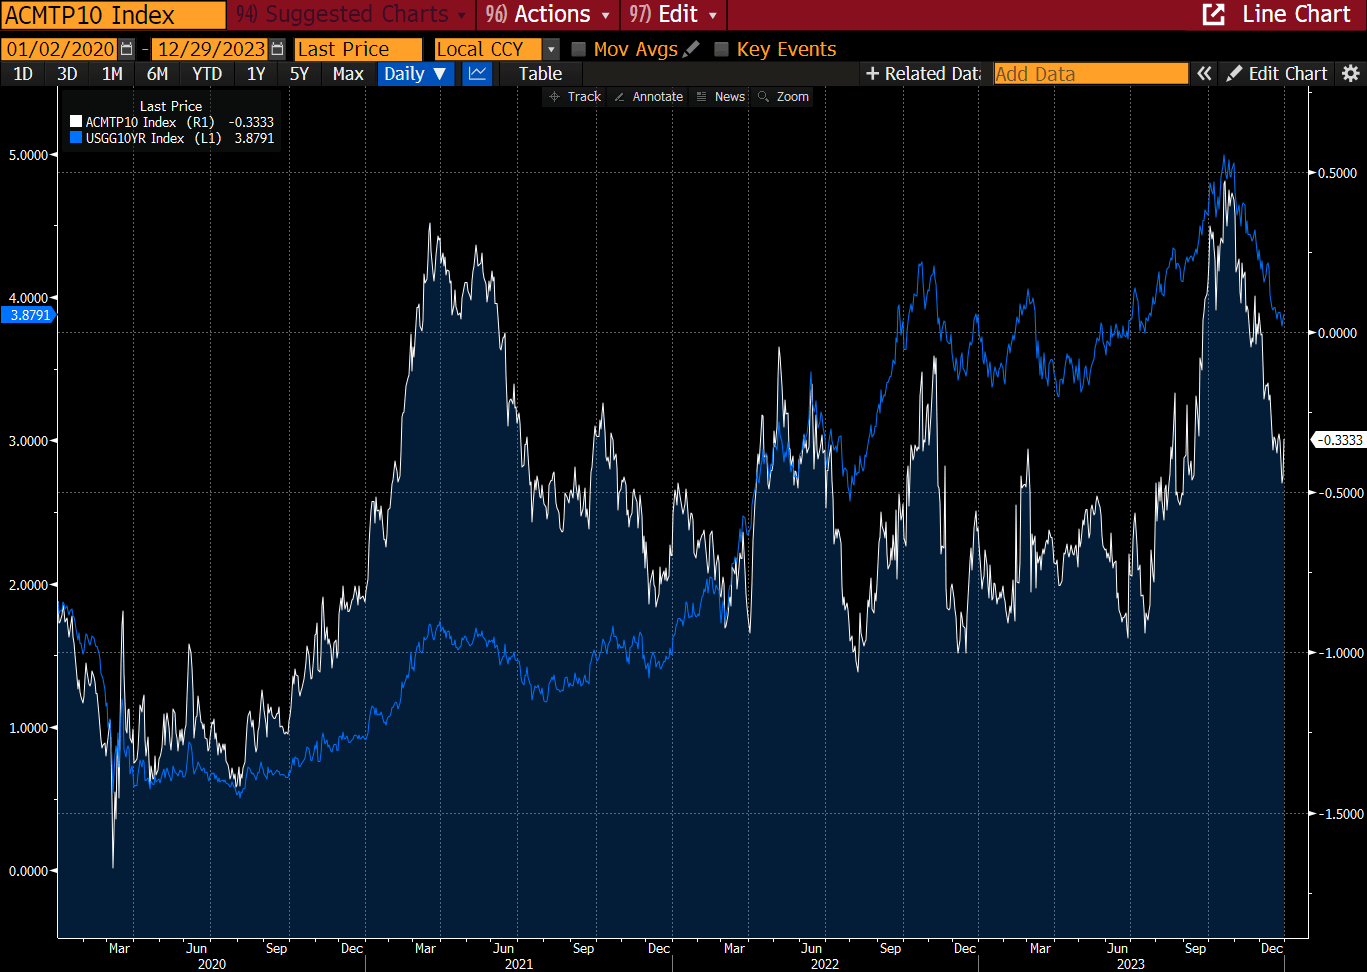
Episode Two: July 2023 — October 2023 (+137 bps)
The second expansion ran from negative 93 basis points to positive 44 basis points, for a total delta of +137 basis points.
In the summer of 2023, investors were pricing an overshoot in the disinflationary process, betting that the Fed had over-tightened.
Term premiums collapsed as markets began pricing a recession that never came as a result of the Fed’s most aggressive policy rate hiking cycle in two generations.
Risk premiums bounced from deeply negative in July 2023 as they begin to front run hot inflation data in September 2023 plus a monster Q3 2023 GDP print
By the time term premiums peaked on October 25, 2023, markets were already looking past the noise.
A documented record from these pages — written in real time — called the growth slowdown in advance, went long 10’s on October 26, 2023, and by November called the soft landing then declared the Fed hiking cycle dead in December.
Episode Three: September 2024 — Present (+111 bps and Counting)
The current episode began on September 11, 2024, at negative 28 basis points. It was catalyzed initially by the Fed’s surprise 50-basis-point cut on September 18th, 2024, which took recession risk off the table.
A strong September employment report, the election of Donald Trump, and a rapidly evolving inflation picture have since added fuel (tariffs and a war-of-choice-induced supply shock).
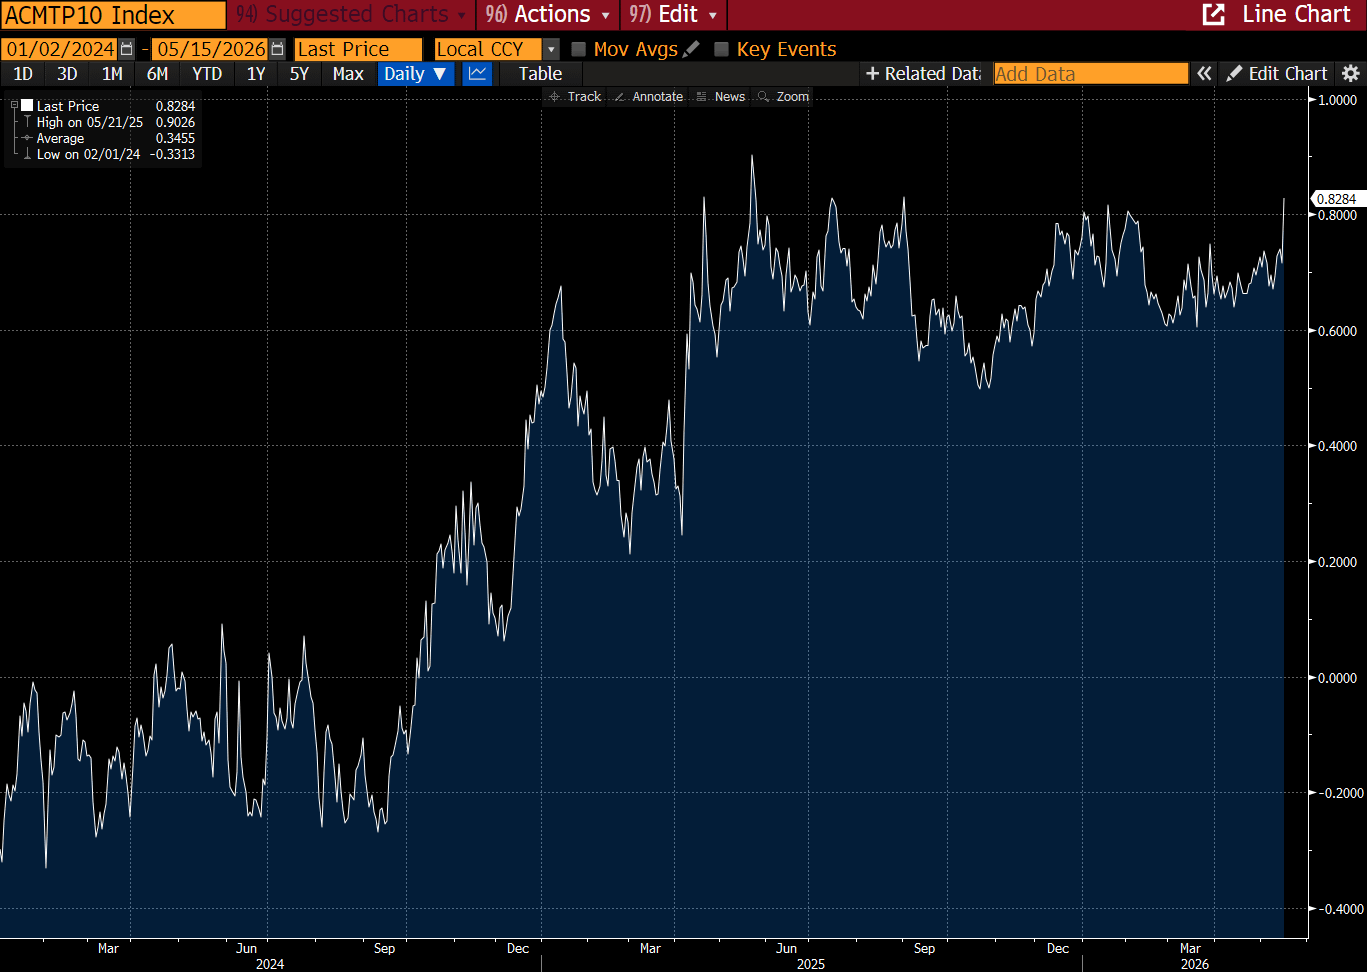
Term premiums briefly went negative again on December 2, 2025 before reversing decisively. They now sit at 83 basis points — near the absolute highest of the cycle – and reflect a total 111-basis point upside move.
Unlike the prior two episodes, which were driven by a single dominant causal variable — inflation expectations in 2020-21, disinflationary overshoot fears in 2023 and then a subsequent violent reversal — the current expansion is driven by a multi-causal, structurally ambiguous set of forces.
That ambiguity is not incidental to the thesis. It is the thesis.
III. CALIBRATING THE MOVE: WHAT THE HISTORICAL DISTRIBUTION SAYS
Before examining the causal drivers in detail, it is worth stepping back and asking a quantitative question: how extended are current levels relative to history, and how much room remains before nominals become statistically extreme?
Using daily data from the NY Fed ACM model (July 2004 through May 2026, n=5,400 observations) for nominal yields, and TIPS-based real yields from January 2009 forward, the following picture emerges. The Bloomberg 5Y5Y inflation swap (FWISUS55) serves as the forward inflation expectations input — the swap-based rate is methodologically cleaner than the Treasury-derived FRED equivalent, stripping out the TIPS liquidity premium that distorts breakeven readings during stress periods.
Standard Deviation Framework — 10-Year Yields
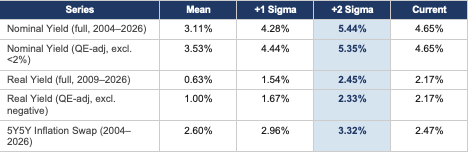
Sources: NY Fed ACM Model, Bloomberg FWISUS55. Real yields from Pinebrook 10YR Daily Analysis (TIPS-based). QE-adjusted series excludes periods of financial repression.
Several observations follow directly from this data.
Real yields, at 2.17%, are already deep inside the 1-sigma band on both the full-history and QE-adjusted series (2.45% and 2.33%, respectively) and pushing towards the 2-standard deviation band.
The work of repricing real rates higher — a process that began in 2022 — is largely done as real’s approach their upper historical bound.
The nominal 2-sigma ceiling sits between 5.35% and 5.44%, depending on the sample.
At 4.65%, there are approximately 70 to 79 basis points of room before nominals reach a level that would be statistically extreme relative to the post-2004 distribution.
This is meaningful runway — but it is not unlimited.
The composite upper bound — constructed by adding the 2-sigma real yield to the current 5Y5Y inflation swap — produces a range of 4.80% to 4.92%.
Current nominals at 4.65% are near this range.
In plain terms: the statistical framework says nominals have room to move a bit higher to the high 4%’s, before hitting a historically extreme ceiling in the 5%’s.