Weekly Signal and Noise Filter
Is the air getting thinner in the rates complex?
As the 10-year note made new all-time highs last week, briefly tagging above the 5% level intraday, it is fitting that we start this week’s note by asking, how high can we go?
I will be the first to admit that calling tops and bottoms is a tricky business, and there is a graveyard full of callers – top or bottom – with rekt PNL’s.
Still, it is useful to have a reasonable view on where things can go, both within the bounds of “normalcy” (whatever that means) and beyond.
I have focused my work on real rates since summer, which have been on the move after being deeply negative after the start of the pandemic.
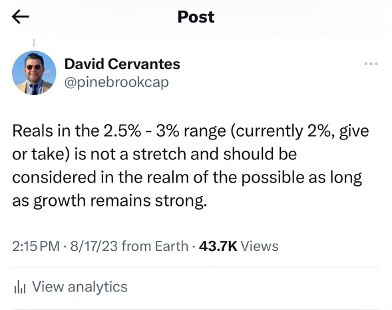
As part of a broader thread on Twitter on August 17th, I mentioned that real rates, then at around 2%, could go to somewhere between 2.5% and 3%.
The basis of this comment was a historical review of real rates over the long term.
The FRED data sets maintained by the St. Louis Fed go back to January 2003 and reals look like this.


