
Market Commentary
Navigating the Scylla and Charybdis


In Homer’s Odyssey, Odysseus is warned that he must sail through a narrow strait flanked by two inescapable dangers: Scylla, the six-headed monster on the cliff, and Charybdis, the whirlpool capable of swallowing the entire vessel. There is no safe passage. There is only the discipline to identify which risk to manage more carefully, and the nerve to sail.
Markets in April 2026 have placed investors in a structurally analogous position.
On one side churns the Charybdis of American exceptionalism running at full throttle — S&P 500 net margins at a fifteen-year record, forward earnings at an all-time high for the 49th consecutive week, a labor market printing 189,000 initial claims against a long-run average of 220,700.
On the other side rises the Scylla of global macro deterioration — a Strait of Hormuz that remains functionally closed with no credible off-ramp in sight, a Eurozone sliding into stagflation with its anchor economy at Covid-era weakness, and an inflation pipeline in fertilizers, food, healthcare, and freight that is no longer prospective. It is arriving.
This note is a navigator’s chart. Every section below is written with one purpose: to create new forward-looking knowledge, not to report what is already known. The navigation section translates that knowledge into specific, actionable trade expressions.
On March 30th, these pages published a detailed economic framework mapping the distributional path of the US economy under the assumption that the Strait of Hormuz remained effectively closed through June or July — the worst-case kinetic timeline.
That framework projected Q2 GDP potentially contracting to -0.5%, Initial Claims spiking toward 320K by June, unemployment peaking at 4.9% in August, and core PCE hitting 4.4% YoY by September. It was explicitly called not a collapse, but the first real test of the post-Covid resilience thesis.
That worst case has not materialized — and the reason is instructive. The conflict evolved into a stalemate governed by ceasefire rather than sustained kinetic escalation. The most destructive scenarios in the March framework required continuous military action degrading infrastructure and supply chains beyond their current state.
The ceasefire interrupted that path.
What we have instead is something more insidious and harder to trade: the shooting has largely stopped but the oil is still not flowing.
The supply shock is real and persistent, but the acute demand destruction from $4.12 gasoline is being absorbed by the trillion-dollar capex cycle that has been a theme of these pages.
The labor market, as this morning’s 189,000 Claims print confirms, has not broken.
The March framework’s Okun’s Law mechanical linkage — GDP contraction feeding into unemployment — has not been triggered because the GDP contraction itself has not occurred.
The honest read of the data is that the economy navigated the acute phase of the shock better than the conditional framework anticipated. The current 2.3% annualized GDP print is not what a supply-shocked economy looks like. However, the inflation pipeline — fertilizers, food, healthcare, freight — is real and building.
The doom scenario required a war that kept escalating. What we have instead is a stalemate that keeps oil prices elevated without producing the demand destruction cascade. That is a different and more nuanced problem than what we mapped in March. It is also, as this note argues, a more investable one.
I. THE MACRO BACKDROP: THIS MORNING’S DATA IN CONTEXT
May 1, 2026 — A Morning That Confirms the Pinebrook Framework
Yesterday morning’s simultaneous release of PCE, GDP, Initial Claims, and the Employment Cost Index is the most important single data day for understanding the macro regime Pinebrook has been documenting since February.
The results confirm a call these pages made before most of the street had caught up: the US economy is simultaneously stronger than the consensus feared and more inflationary than the Fed’s projections allowed.
GDP: +2.3% annualized QoQ, beating the 2.0% consensus. This follows Q4 2025’s 0.5% print — a sharp acceleration that validates the restocking cycle thesis identified in the January ISM Manufacturing note on February 3rd, when ISM New Orders surged from 47.7 to 57.1. The consensus was too bearish on growth. The GDP confirms that shift was real.
Initial Claims: 189,000 for the week of April 25 — beating the 212,000 consensus by 23,000. This is an extraordinary print. The 4-week moving average has fallen to 207,500. Continuing Claims dropped to 1,785,000 from 1,821,000. The labor market is not in low-fire mode. It is actively tightening. Pinebrook first called the labor market’s immunity to recessionary pressure on January 20th, claims were running near 210,000. Three months later, the data has tightened further.
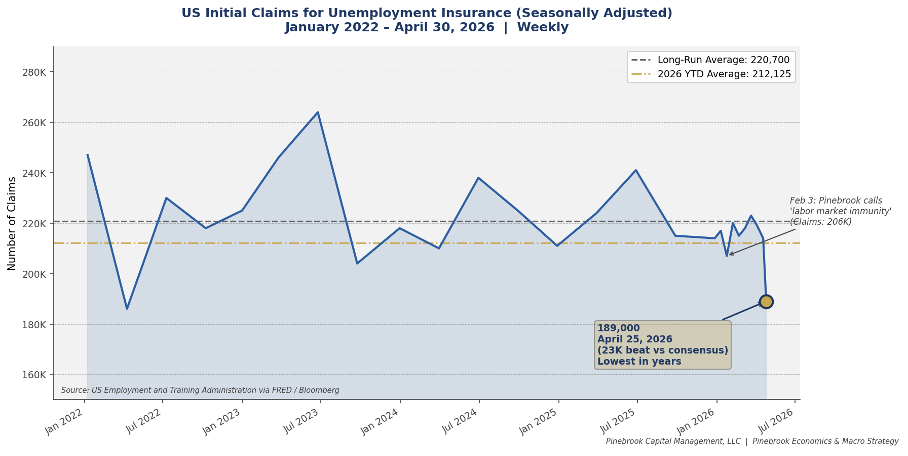
Chart 1: US Initial Claims for Unemployment Insurance — 189,000 print on April 30, 2026 confirms labor market immunity thesis.
Core PCE: +3.2% YoY, +0.3% MoM — in line with consensus. The in-line print avoided the worst-case scenario and is generating a 10-year bond short cover bid this morning. But in-line at 3.2% is not benign — it is accelerating from 3.0% in February. In the March 1st Signal & Noise Filter, these pages showed the base effects math explicitly: for the Fed’s prior 2.5% core PCE projection to materialize, month-over-month inflation would need to run at essentially zero for six consecutive months. Core PCE of 0% MoM would be a deflationary shock. The math was always going to force the FOMC to revise their inflation projections upward. It has.
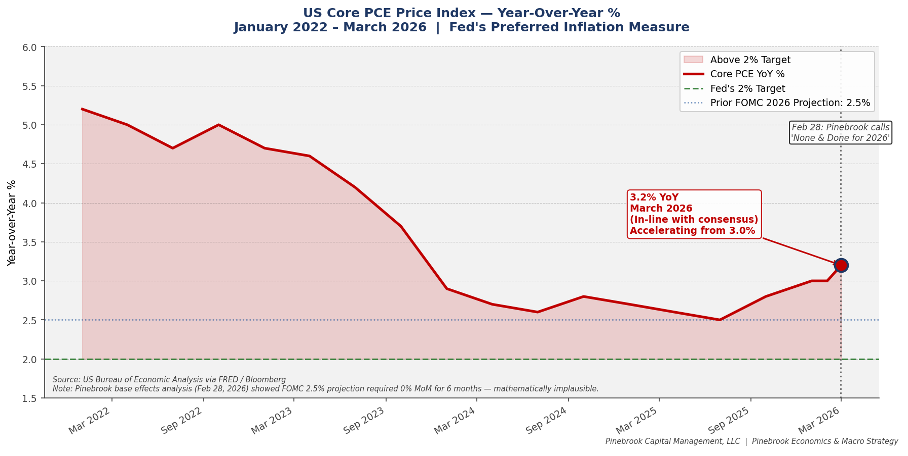
Chart 2: US Core PCE YoY % — accelerating to 3.2%, well above the Fed’s 2% target and prior 2.5% projection.
Employment Cost Index: +0.9% QoQ, beating the 0.8% consensus, up from 0.7% prior. The headline beat obscures the most analytically important detail: within the ECI, wages and salaries grew +0.7% QoQ while benefit costs grew +1.3% QoQ — benefits growing at nearly double the rate of wages. Healthcare benefits specifically are up 5.7% year-over-year, the fastest growth since the early 2000s. This distinction matters enormously for the forward-looking framework and is addressed in detail below.
Taken together, these four releases validate a framework Pinebrook established in real time. On February 3rd, these pages called the restocking cycle and said the consensus was too bearish on growth. On March 1st, these pages officially called ‘None and done for 2026’ on rate cuts, identified healthcare and energy as the inflationary broadening mechanism, and flagged that Romer & Romer would be undermined by the strong labor market.
Today’s data is not a surprise to this framework. It is a confirmation of it.
II. SCYLLA — THE MONSTER ON THE CLIFF
The Hormuz Stalemate: Duration Is the Variable the Market Is Still Mispricing
Two months into the effective closure of the Strait of Hormuz, the defining investment question is not whether the disruption is real — the physical market settled that argument in February — but how long it lasts.
Polymarket’s contract on Hormuz traffic returning to normal by end of June stood at 52% as of April 29th, down from 88% on April 17th. That 36-point collapse in 12-days is the market repricing this duration in real time.
It still has further to go.
The geopolitical architecture argues for a longer stalemate than consensus expects. Trump cannot frame a ceasefire as a win on current terms. Iran’s conditions have not materially changed. The GCC states, particularly the UAE whose OPEC withdrawal was announced this month, are repositioning around a post-Iran regional order that requires Iran to be structurally diminished.
The physical infrastructure damage — an estimated -1.2 billion barrels of inventories lost through end of April, growing to -1.8 billion by end of June — is unforgiving arithmetic. Remediating a June-end inventory loss of that magnitude requires a surplus of +2 million barrels per day sustained for 900 days.
The pre-war range of $55-$75 for Brent is gone regardless of ceasefire timing.
The Inflation Pipeline: No Longer Prospective
The inflation pipeline described in February is arriving. Gas prices have moved from $2.94 per gallon the week before the Iran strike to $4.12 as of April 27th — a 40% increase in two months. Consumer surveys from the University of Michigan show households expecting gas prices to be 40-50% higher over the next five years.
The Strait of Hormuz carries roughly one-third of globally traded fertilizers and 85% of Middle Eastern polyethylene exports. The disruption struck at the start of the Northern Hemisphere’s spring planting season. Lower fertilizer application this season means lower crop yields, which means higher food prices in H2 2026 and into 2027 — baked in regardless of when the war ends.
Today, ISM Manufacturing Prices Paid printed at 84.6 in April — the highest reading since mid-2022 and a massive 4.3-point beat above the already-elevated survey of 80.3. ISM Manufacturing Employment simultaneously contracted to 46.4 — the K-shape in one data release: input costs surging while hiring falters.
ISM Services Prices Paid surveyed at 73.5 for the May 5th print, pointing higher still.
Rate cuts cannot fix either side of this equation.
The Warsh Head Fake: Rate Policy Is the Wrong Tool for This Problem
Today — with 189,000 Initial Claims, core PCE at 3.2% YoY, GDP at +2.3% annualized, and ECI benefits growing at nearly double the rate of wages — the no-cut call is no longer controversial.
But the more important forward-looking insight is not whether Warsh cuts. It is why rate policy is the wrong instrument for the problem he is inheriting.
The ECI breakdown tells the story: wages and salaries +0.7% QoQ, benefit costs +1.3% QoQ. Healthcare benefits up 5.7% year-over-year — fastest growth since the early 2000s.
The New York Fed’s Regional Business Survey confirms businesses reported double-digit percentage increases in health insurance costs and that wage growth would have been 0.9 percentage points higher if healthcare costs had held constant. Individual market benchmark silver plan premiums increased 21.7% in 2026.
The mechanism is precise: healthcare functions as a head tax on employment. Rising employer-sponsored insurance costs suppress wages without raising take-home pay. Compensation costs increase, but the increase accrues to insurance companies and healthcare providers — not to worker paychecks.
And here is the critical point: lower interest rates cannot fix it.
A rate cut does not reduce healthcare premiums.
A rate cut does not lower gasoline prices.
The consumer being squeezed by $4.12 gasoline and a 21.7% increase in insurance premiums is not being squeezed because money is too tight. They are being squeezed by supply shocks structurally independent of monetary policy.
CME FedWatch gives 80.4% odds of no change through year-end — Pinebrook has held that view since March 1st.
Europe: Stagflation Without the Tools to Fight It
Stagflation has arrived.
The Eurozone’s April composite PMI fell to 48.6 — the first contractionary reading in 16 months.
Eurozone inflation accelerated to 2.6% YoY in March from 1.9% in February.
Q1 GDP was revised down to +0.1% QoQ.
The DAX has returned 7.98% on a total return basis (in local EUR currency) over the last 12 months during a global AI boom, compared to 29.44% for the S&P500.
The 10-year Bund yield has risen toward 3.03% — its highest since 2011. The rise in isolation is not the issue. It’s the rise in a low growth context that has little buffer before contraction.
The structural dimension is more consequential than the cyclical. MSCI Europe forward earnings are 0.3% below their record high set in July 2008 — eighteen years of zero net earnings growth. Over the same period S&P 500 forward earnings have risen 350%.
US nonfarm productivity runs at +2.5% YoY versus Eurozone productivity at +0.5% YoY — a five-times wedge that is structural in origin.
Europe has no hyperscalers, no fabless champion, no model lab at scale. The MSCI forward P/E spread between the US and Europe is not irrational exuberance. It is the rational pricing of a structural earnings divergence. That spread widens further if Europe has no answer to the AI capital concentration driving US corporate profitability.
As discussed here and here over a year ago, it is now clear that European equity outperformance was simply a currency enabled mean reversion mirage that is now over.
III. CHARYBDIS — THE AMERICAN MACHINE
The Margin Record: Broad, Structural, and Explained by Kalecki
S&P 500 net margins are set to reach 13.4% in Q1 2026 — the highest reading since FactSet began tracking the data in 2009. The forward path: 14.1% in Q2, 14.6% in Q3 and Q4. But the more important analytical point is the breadth of the improvement. Six of eleven S&P sectors are posting net margins above their five-year averages: Technology (+3.8 pts), Financials (+2.2), Communications (+1.5), Industrials (+1.5), Utilities (+0.5), Consumer Discretionary (+0.4). Whenever you hear the margin improvement attributed solely to Tech, remember that data.
This breadth demands a macroeconomic explanation. Michal Kalecki’s fundamental insight is that aggregate profits are generated by aggregate investment — investment creates income creates consumption creates profits, circularly, across the entire economy.
The $1 trillion US AI investment cycle is not extracting profits from a fixed pie. It is generating them through the circular flow of spending. The hyperscaler infrastructure spending flows to NVIDIA for GPUs, to construction firms building data centers, to electrical utilities expanding grid capacity, to equipment manufacturers supplying cooling systems.
Those revenues flow into wages.
Those wages flow into consumer spending.
That spending flows into the margins of Consumer Discretionary, Industrials, and Financials companies that have no direct AI exposure.
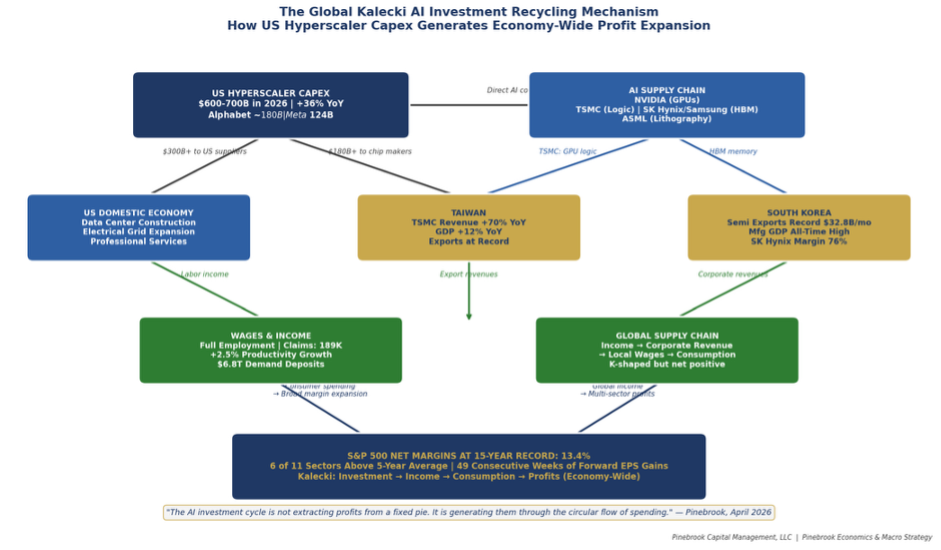
Chart 3: The Global Kalecki AI Investment Recycling Mechanism — How US hyperscaler capex generates economy-wide profit expansion.
The doomer scenario — AI concentrating profits in Tech while cannibalizing the rest of the economy — would produce sector divergence. The FactSet data shows sector convergence. This is the Kalecki recycling mechanism working precisely as the theory predicts. As long as the AI investment cycle continues generating the circular flows of income and spending, the margin improvement remains broad.
Is 13.4% the Ceiling or the Floor? A Three-Source Triangulation