

This note picks up where Friday’s PPI recap left off: observing the highest inflation print in two years in the context of a low hire/low fire labor market, popping credit spreads, a flattening yield curve, and now, a kinetic strike on Iran that introduces oil risk into inflation risk premia.
Noise vs. Signal.
There is a lot of wood to chop, and we are getting after it here, far from Mexican cartels and Iranian mullahs. En-Shala. 🙏
This is what spot inflation looks like.
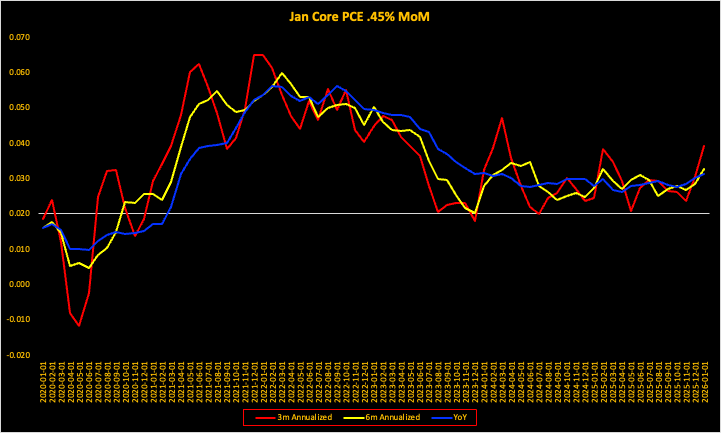
The first question is how much of this is a noisy echo from past policy choices (tariffs + big fiscal + prior rate cuts over the past two quarters) and how much of this represents a forward-looking inflection point?
The second and more important question is, what is the FOMC’s most likely reaction function?
1. Transitory inflation look-through which prioritizes the labor market in the face of high spot inflation but with the expectation of future lower trend inflation, which has been the policy Rx by Romer & Romer for this cycle?
To spare new reader search within the above link, the relevant passage is provided:
“To do so, the Fed is employing the Romer & Romer playbook that was referenced in the inaugural note of this series. Recall:
“In particular, we now also look for times when policymakers believed that they were at a stable level of economic activity but took actions to lower the unemployment rate—and were willing to accept adverse consequences for inflation.
That is, we look for times when policymakers were deliberately shifting the aggregate demand curve out because of a change in their view of the acceptable or desirable level of unemployment.
If monetary policy has real effects, output should rise following such actions.”
-(Romer & Romer 2023).
2. Shotting Romer & Romer in the head and abandoning the labor market?
3. Some combination of the above.
To form an understanding of the above, we must look at the sources of the inflationary impulse, and the likelihood of their persistence.
Airfares were flagged as a wild card in the original January inflation preview. They did not disappoint in the PPI, with domestic coming in at 3.5% MoM and international at 1.9% MoM.
Healthcare was also flagged yesterday. The real driver of January’s gain was services for other medical services outside of physician services and medical labs. Healthcare pricing power will remain elevated due to higher reimbursement rates.
These are market-based, non-housing services that the Fed takes seriously, particularly as healthcare spending is roughly 20% of U.S. GDP.
In addition, there is a parade of horribles still lurking in the wings—tariffs, a DRAM bottleneck threatening consumer electronics and autos, and a World Cup tourism surge teed up for later this year. And of course, now, this weekend, a strike on Iran.
With U3 at 4.3%, the case for additional cuts this year has been Mencho’d by the strong labor market that Romer & Romer was designed to protect.
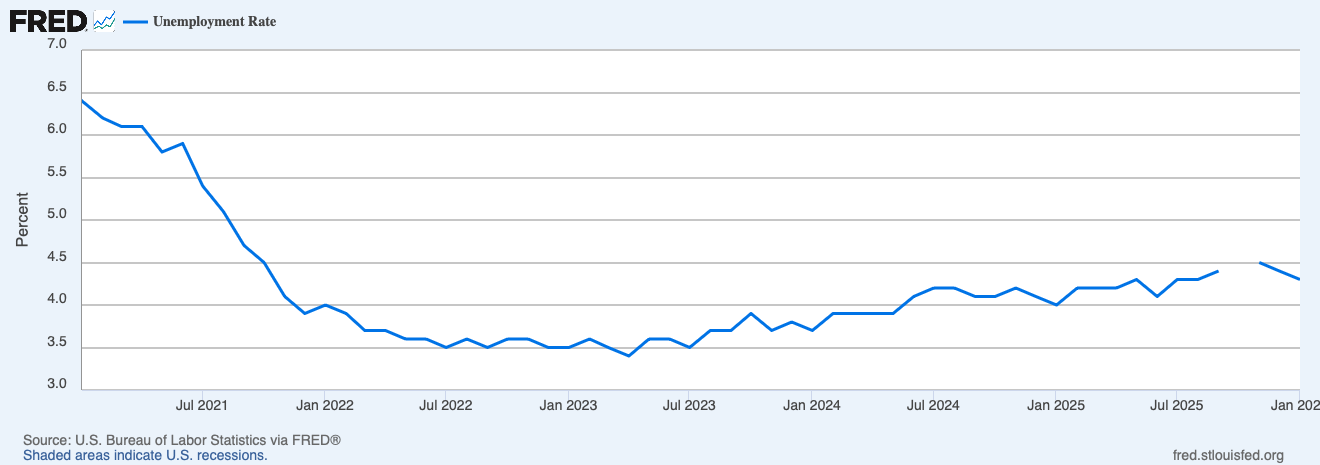
Of course, the FOMC will not come out swinging with this, especially considering Warsh’s stated policy preference for lower policy rates.
However, the FOMC will likely end up revising up their core PCE numbers for 2026 at the March FOMC meeting.
It simple, and no narrative conjecture needs to be provided. The math of inflationary base effects is unforgiving, especially in the face of shrinking labor market that has become immunized against low payroll growth.
Below is a table showing the monthly average core PCE prints and corresponding YoY prints for each year of the post pandemic cycle.

If we very charitably assume that after January’s projected hot core PCE print of .45% MoM that month-to-month inflation suddenly reverts back to the 2023 – 2025 disinflationary average of .25% MoM and stays constant around there for the remainder of H1 2026, we end up with a projected inflation profile that looks like this.

Visually
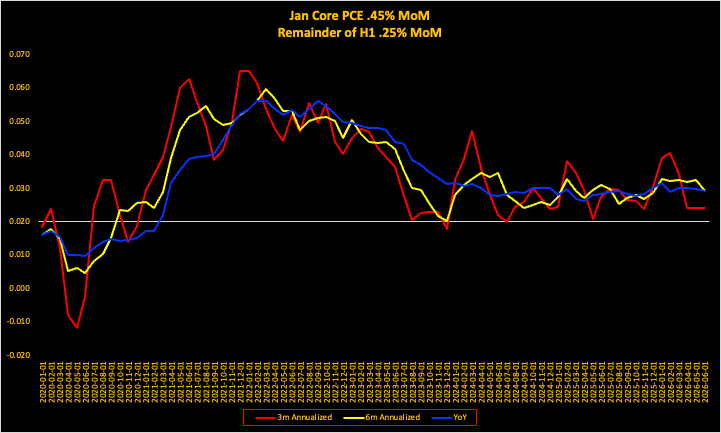
The current FOMC core PCE projection for 2026 is 2.5% YoY.
For the Fed’s projection to materialize:
2026 H2 core PCE would have to be in the 2% area.
For this to happen, MoM core PCE would need to be zero for six straight months after the generous H1 assumptions.
While averages have their limitations, they do establish bounds of realism around projections. Core PCE of 0% MoM is not happening, as that would be a deflationary and depressionary shock to the economy.
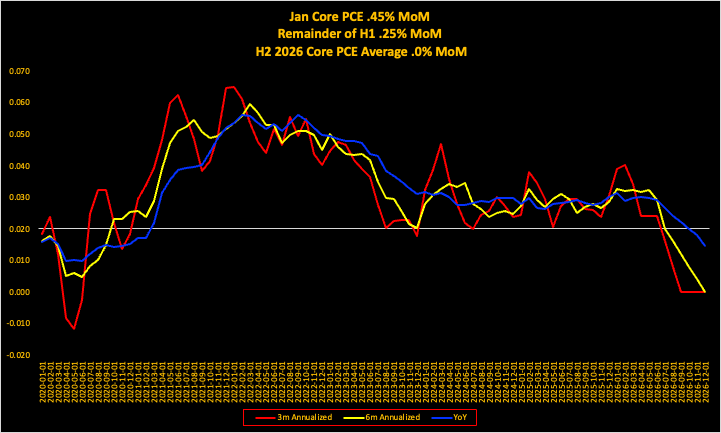
The only way for the FOMC to square the circle around their projections is to raise their core PCE forecast for 2026.
This is the signal, as it allows for choice (3) above, which is a compromise between not abandoning the labor market while acknowledging the reality that transitory has entered it 6th year and the inflationary outlook is worserer (not a typo).
Mideast geopolitical tensions are back in the driver’s seat with this weekend’s U.S. military incursion into Iranian airspace.
These pages will not speculate on the potential duration of the conflict. The asymmetry of an inflationary impulse is what is of concern these here. It is therefore a good time to consider what swiftly rising energy prices might do to inflation and the US economy.
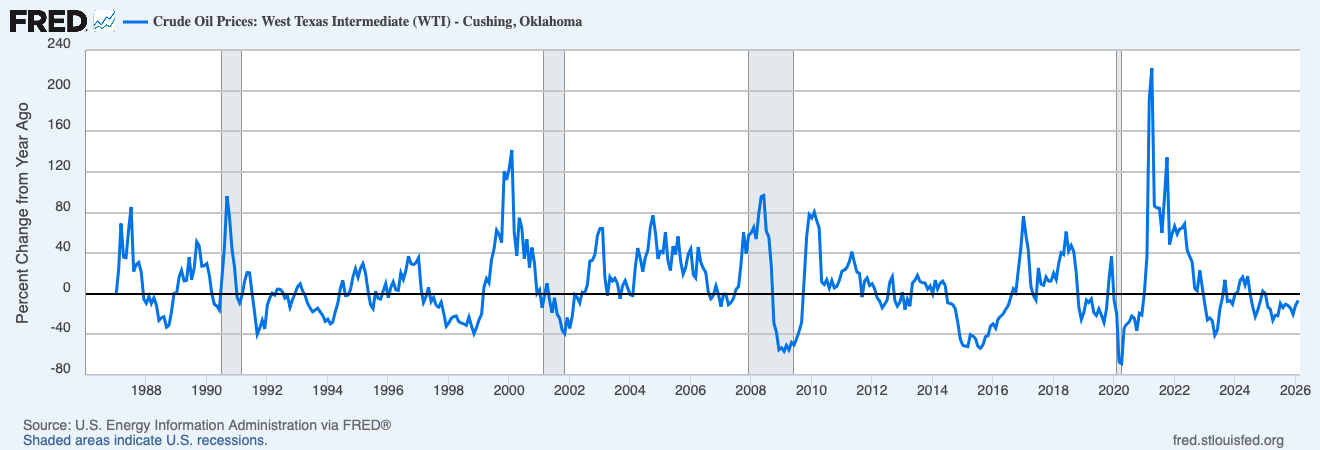
Since 1972, oil prices have jumped by at least 80% on a year-over-year basis exactly eight times.
The 80% threshold is a recessionary smoking gun in plain sight; with a hit rate that is uncomfortably high. In five of those eight instances, an 80% energy spike was either the lead-in to, or the catalyst for, an NBER-defined recession.
1973 & 1979: Classic geopolitical supply shocks (Saudi oil embargo/Iranian Revolution).
1990: The Kuwait invasion.
2000 & 2008: The “Commodity Supercycle” era, where energy prices eventually outpaced the consumer’s marginal ability to pay.
To be fair, the 80% rule has had three “false” alarms: 1987, 2010, and 2021, where these price hikes were off of exceptionally low oil prices.
Budgetary price rigidity is bottom line.
When energy prices move this fast, they function as an immediate, regressive tax that forces households to pullback on discretionary spending.
When energy prices spike vertically, there is no immediate substitution effect. You can’t stop driving to work tomorrow.
If energy stays bid, the broadening-out trade for the 493 gets significantly more complicated.
$103/barrel oil is the recessionary trigger point, as that is +80% more than the 12-month prior low of $57/barrel.
This is not a base case for three reasons:
Mid-term elections (a drawn-out conflict will be a doomer-event for the party of Trump).
A quick strategic win or a Taco (Trump always chickens out). 🌮🌮🌮
The eggheads at the Dallas Fed have modeled out $100/barrel oil in the event of a closure of the Strait of Hormuz.
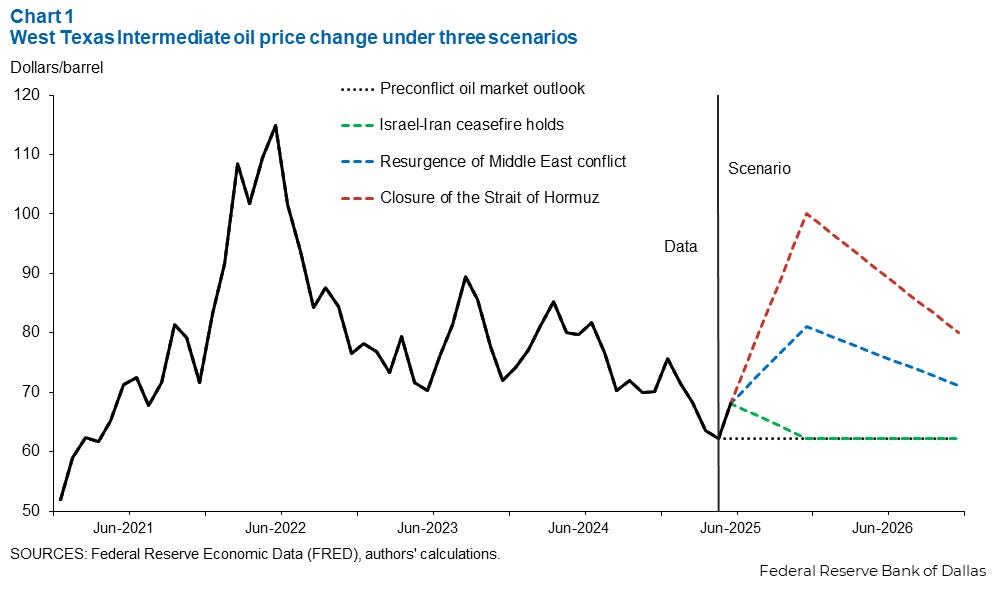
The Dallas Fed study is obviously a best guess, but it does offer a useful framework from past experiences and structural drivers of inflation and inflation expectations.
The political and military situation is fluid, but in the view of these pages the tails are bounded. Trump does absolutely not want a dragged out, boots-on-the-ground military escalation.
The Q1 inflationary impulse is broadening beyond trade-war or kinetic war noise.
The Fed is now in a deer in headlights moment, caught between a resilient labor market and sticky services inflation.
Pinebrook is officially removing a sole 2026 cut from its baseline forecast. None and done for 2026.
The above is despite the chatter around private debt reaching a fever pitch.
Private credit - nonbank lending primarily servicing the private equity complex – is a $3–$4 trillion opaque behemoth, with the U.S. accounting for the lion’s share (60-70%).
A third of these debt instruments are concentrated in software companies.
As these pages have documented, the AI cycle is the dominant macro factor of 2025/2026. While the hyperscalers are printing cash, the middle-market software firms - the ones levered to the hilt in the private debt market - are being roiled by advancements in AI that threaten their legacy business models.
For now, the credit cycle remains in expansion mode, but the “trash spread” in private markets is likely wider than the public marks suggest and there has been some spillover in public debt markets.
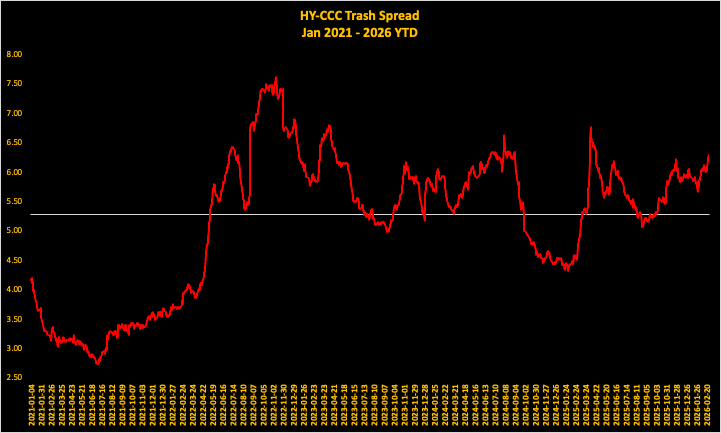
For the uninitiated, the trash spread is the level between the dominant high yield index and the lowest of the low graded credits. The informational signal value comes from the idea that the lowest rated credits are the most sensitive to cash flows that covers their coupon.
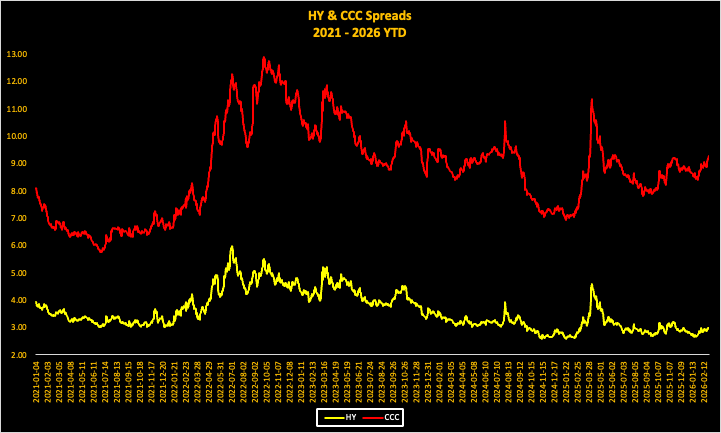
CCC credits are highly correlated to the broader index, but they are more volatile and amplified.
Below is a chart of the HY index and CCC credits for this cycle.
Below is a chart of the spread between the two time series for the same lookback window.
Finally, here is a zoomed in view into the spread focusing on 2025 – 2026 YTD.
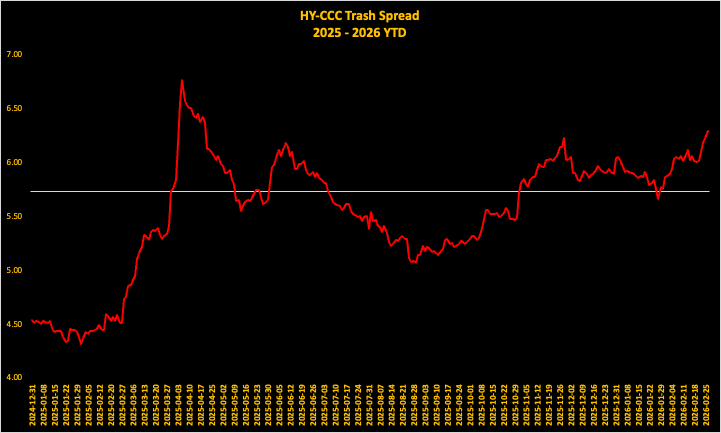
The trash spread bottom in late August 29, 2025 after the Liberation Day spike in April of 2025.
The trash spread is 123 basis point higher since then.
Below are what annual averages have looked like during this cycle.

The broader high yield index is still below the cycle average for 2026, at 2.81% versus a 2021 -2025 cycle average of 3.49%.
CCC is just below the same cycle average at 8.76% vs. 8.77%.
Financial stress from the lower part of the credit spectrum has not bled into the broader credit complex.
The proper context for risk reference points are the Silicon Valley Bank mini-financial crisis of March 2023 and Liberation Day in April 2025.

In the prior macro crisis of this cycle, weakness in both the broader index and the lower part of the spectrum co-conspired to reflect a true risk-off.
While we are not there yet, the situation should be monitored, to quote EU Commission President Ursula von der Leyen when discussing American air strikes in Iran (cue the ironic laugh track here).
Concluding Remarks
An inflationary impulse in the context of an improved labor market is evident.
Romer & Romer will be diluted to focus on the inflation problem that is metastasizing.
The math base effects of the inflationary trajectory make the FOMC’s current core PCE projection irrelevant and they will be forced to move their inflation target up.
Thus, the FOMC is none and done this year regarding policy rates cutes.For now, the military strikes in Iran will likely have a limited impact on the economy and financial markets.
The trash credit spread, and its composition, offer more signal about the business cycle than the Treasury market, as Treasuries become safe-haven bids in times of kinetic military action and geopolitical instability.
Pinebrook’s risk posture remains risk-on, and dips should be bought.
Stay tuned for a note that should be done by Monday morning, which will discuss portfolio adjustments given the above.
David is your no cuts this year view high enough conviction to take a short ZQ position? The curve, at close Friday, was pricing 58 bps of cuts for the Dec contract.
Haha, thanks, David, for the calm analysis. God bless—your article wasn’t about Iran, and you didn’t pretend to be a geopolitical expert. That’s exactly why we subscribe. Hahahaha…
I have two questions:
On rate cuts: should we factor in politics? My sense is that if there are no cuts this year, Trump is going to go crazy?!
What do you think about shorting HYG or KKR? I’m already heavily short KKR, and I’ve recently been thinking about starting a short position in HYG…
Lastly, if you’re going to travel, in the future you should still come to China—such a “safe” country. Over here, everything is under control. It’s honestly so f***ing “safe” right now. Haha.