
U.S. Economic Growth Update
Have the Cockroaches Left the Chat?

Starting with a refresh of the PB Cockroach Meter™️, which looks at the number of 1% trading days in a year. As of the close of April 17, 2025, it looked like this.

As of close of trading on May 9th, the YTD numbers have improved but just marginally so.

Thus, while the VIX index has declined, and markets have staged a remarkable comeback, the YTD volatility cluster ratio of 1% trading days to total trading has only improved by 110-basis points. Signal value or simply noise that will dissipate as calendar base effects kick-in?
We know from our prior cockroach commentary that forward 3-month returns after VIX explosion events above 4-standard deviations (on April 8th) have, on average, been lousy, at negative 40-basis points.
Is past prologue? Will the negative return cockroaches hang around? No one knows for sure. And while market price action can be informative of current and future economic states, price action can also be noisy. That April seems likes a distant bad dream is Exhibit A. in this context.
Ultimately, policy and data evolutions that provide economic gravity will be the tell. Below is a summary of a few foundational ideas that have guided the Pinebrook’s thought process before and after the Liberation Day cycle.
The Big Macro Picture (BMP™️) is driven by sectoral public deficits that are private sector surpluses, which are simply gargantuan in scope and are set to get bigger.
A Regime Changing Economic Shock put the economy in a recessionary window of weakness, which needed to be closed soon to avoid an economic downturn and bear market.
Evolutions in policy developments beyond the tariff walk-backs that looked at tax proposals, the impact of immigration policies on the labor force, and the Fed re-committing to its Romer & Romer playbook of front-running labor market weakness and looking away from one-off price distortions.
In Pinebrook’s view, the recession or no-recession dialog is limiting in its binomial outcomes.
Similarly, the idea that a late-cycle economy is one calamity or calendar period away from recession is equally binomial and un-nuanced. This same fluidity in an economy can keep it in a late cycle state for longer than most are anticipating or even return it a stabilized mid-cycle state.
The economics profession drowns itself in noisy data. Ultimately, what matters most is how much money, in aggregate, people are willing to spend on things and at what rate of change relative to before. That’s it.
When this total amount of cash goes down in real terms, economic contraction takes place, and a process of increased unemployment ensues that ultimately puts millions of people out of work.
As long as American consumers are making more money in real terms than in the past, they will continue to spend it and power the economy forward. This is the flawless historical record with a 100% hit rate.
Real aggregate weekly payrolls tend to slow six to twelve months before going into a recession and are only negative during recessions.
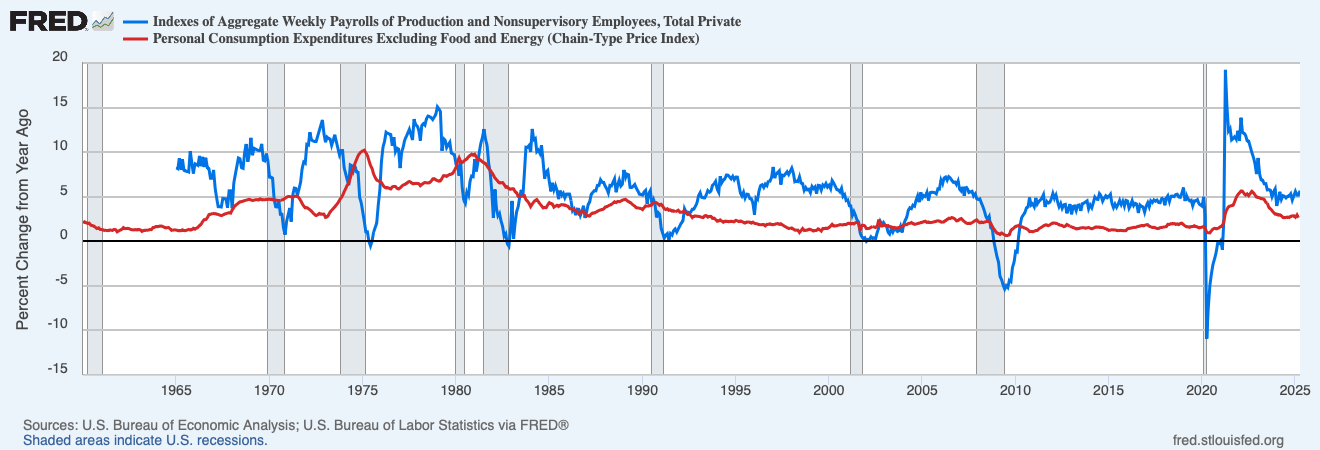
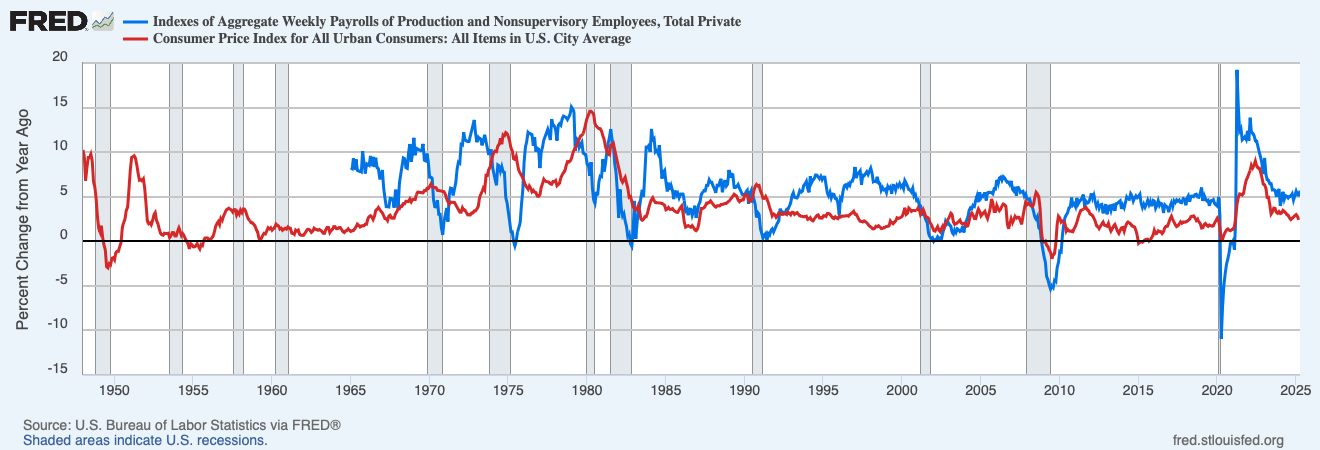
Pushback from some quarters may be that consumers don’t eat core PCE – food and gas are a thing. If headline CPI is used instead, the results are the same.
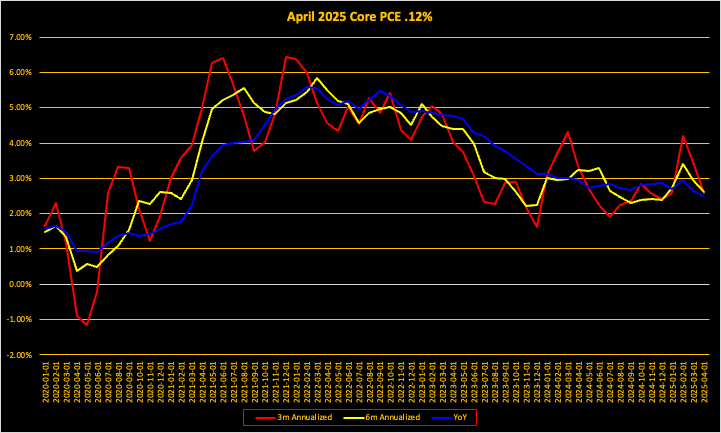
The other side of the aggregate payrolls coin is inflation.
In this cycle Q1 has been the hottest of the year since 2020.
Pinebrook expects this dynamic to continue, with inflation cooling in Q2.
April headline CPI inflation will likely be soft, pressured by falling gas prices, and core CPI will be dragged down by lower lodging and airfares.
Bake in lower portfolio inflation from volatile markets, and the core PCE projection for April 2025 comes in at .12% MoM, for a resulting YoY level of 2.51%.
April 2024 core PCE was 2.95% YoY, suggesting 44-basis points of YoY disinflation.
Outside of either a meteoric employment extinction event, a sudden stop to hiring, or a dramatic inflation moonshot spike (war, pestilence, natural disaster), real aggregate payrolls will likely remain positive through the summer of 2025.
The consensus on forward tariff pricing is for it to be manifested in the economy by mid to late summer. The same consensus has the economy slowing dramatically, possibly contracting, in Q3 2025. There are implications here.
The Fed’s window for a cut is really in June, not September. By September, the tariff inflationary impulse will make the optics of a cut politically difficult. While the Fed targets core inflation, low gas prices which feed into headline inflation and if they persist, will provide optical assistance for a cut.
If this consensus is correct, the economically healthy relationship between nominal wages and inflation will likely not become upside down, if at all, until September of 2025.
Should a drop in real aggregate payrolls not be manifested by September, the idea of a recession in 2025 is effectively dead-on arrival (“DOA”) given the embedded pre-recessionary lag of six to twelve months.
Thus, the recessionary window that was flagged a few weeks ago is now closed but will re-open briefly in late summer.
The tariff shock lasted from April 2nd until April 11th. By the following week tariffs, as a matter of economic policy, were watered down and markets re-priced the forward path of the economy to include a short-term, as opposed to long-term, shock.
There will unquestionably be negative economic consequences. However, the combination of growing deficits, a labor market with potential lower NFP hurdles to maintain U3, and a fiscally expansive tax policy in the works makes continued, even if weak, economic expansion the default modality for 2025.
If the Fed cuts in June, credit markets would likely rally as recession risk recedes further.
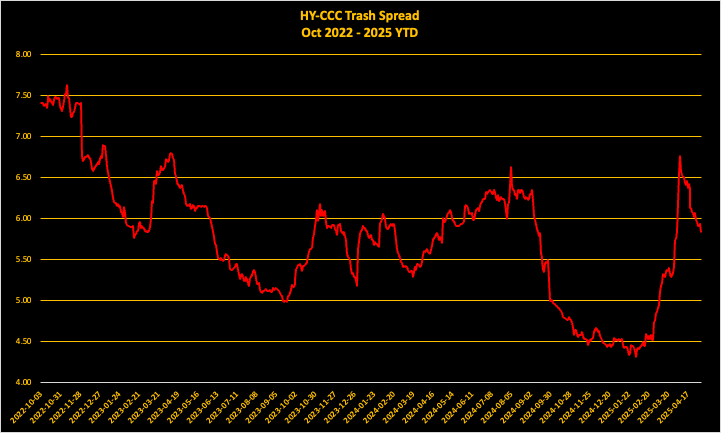
After the initial Liberation Day spike, the cyclically sensitive trash spread (HY index minus CCC credit) is where it was prior to the Fed’s surprise 50-basis point cut in September 2024. A June cut could have a similar positive effects on credit spreads, even if the cut is less than 50-basis points.
Tax policy will be critical. Favorable tax outcomes to middle income spenders in July will be front run by consumers and further inoculate the economy into the September window of weakness.
While the proposed tax relief is for fiscal 2026, higher future take-home income will be leveraged via the credit channel, and credit and lending markets should be monitored to validate this thesis.
If the above scenarios materialize, the Fed will be frozen in its tracks to cut rates in September.
Recall, the tariff inflation impulse will be evident by then.
Increased consumer spending from front running tax cuts would likely revive hiring and broaden the hiring impulse beyond the narrow base of healthcare, education, and government.
While a return to pre-Liberation Day equity price targets for 2025 still seem a stretch, a revival of the 1990’s productivity-fueled growth trajectory comes back into focus, and so does an SPX target north of 6,500.
Thus, Pinebrook’s out of consensus call is for a June cut followed by a pause.
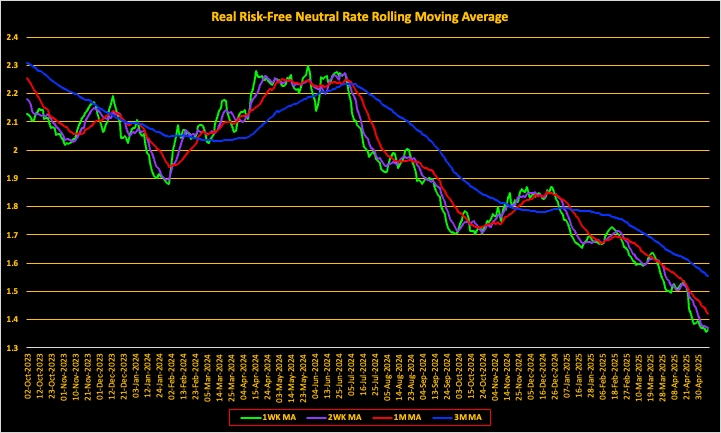
This call is reinforced by the continued collapse in the real risk-free neutral rate. That is, real rates, adjusted for increases risk premiums (68-basis points as of May 8th) due to inflation uncertainty, are at a cyclical low of 1.39%.
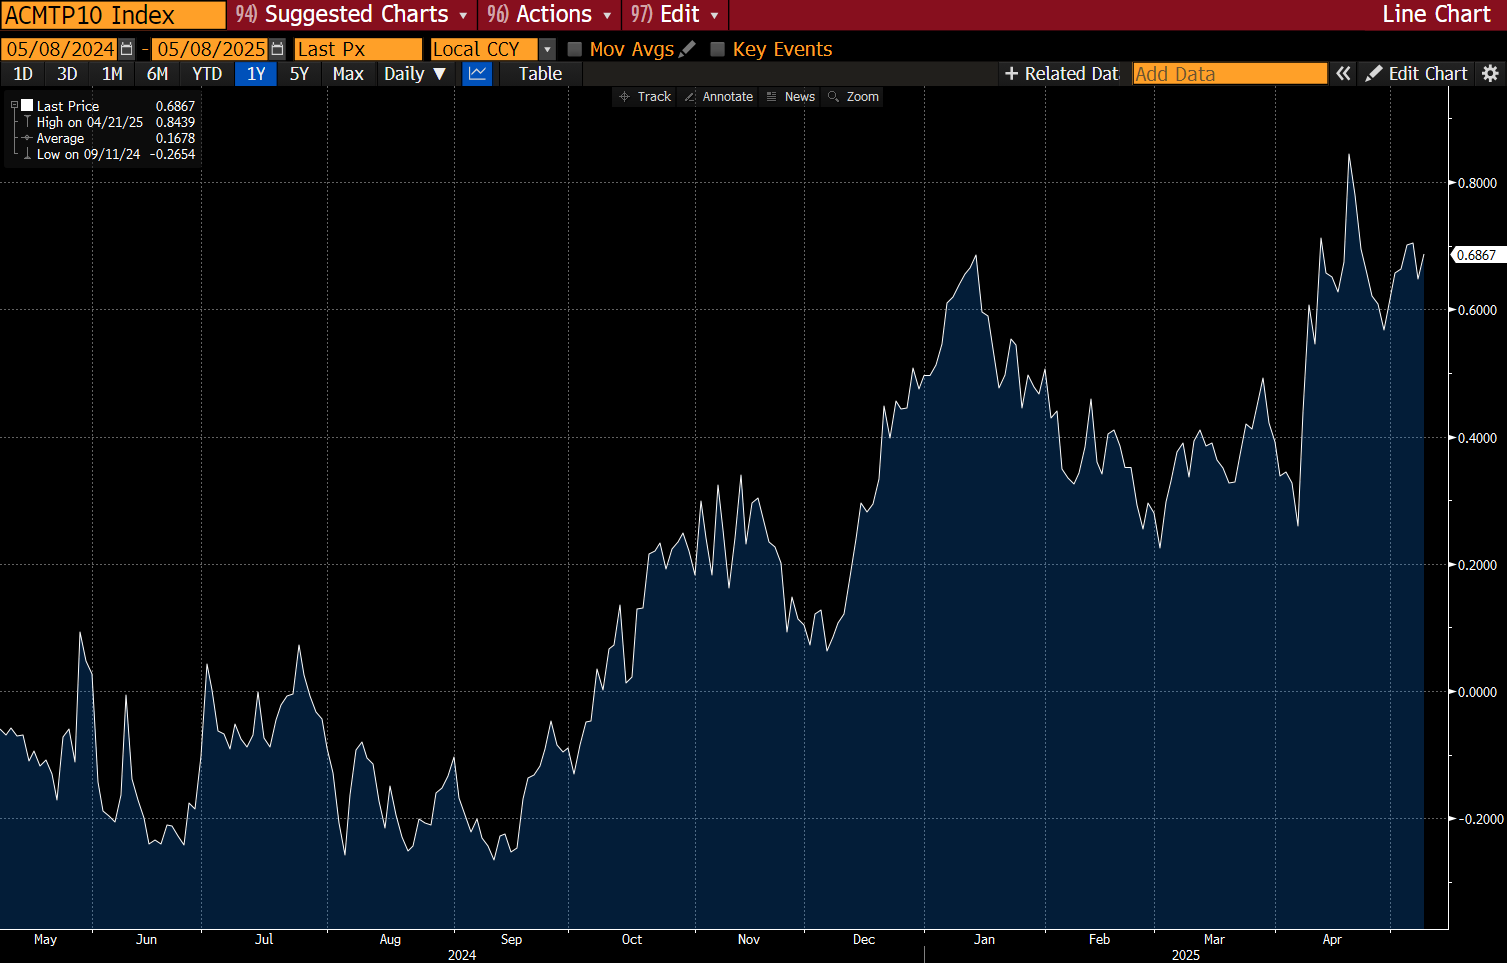
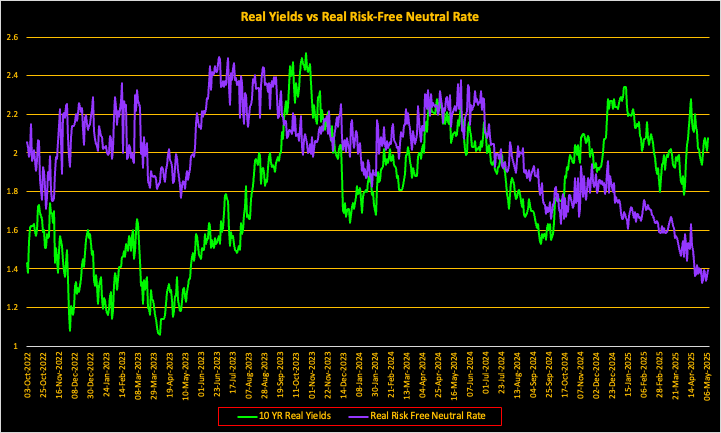
Over time, the RRFNR correlates well to future growth expectations. Diminished expectations began to get priced-in last summer and were given a boost by the Fed’s policy pivot in the fall.
Since the Fed pause and the moonshot in trade uncertainty, future growth expectations have been in decline. The labor market has thus far been resilient. However, the gap between weakening growth expectations and a resilient labor market needs to be resolved.
In short, growth expectations must pick up or risk further weakening of the labor market. This reinforces the motivation for a June cut.
In summary, the U.S. economy is expected to slow but has the structural supports of an expansive fiscal and market friendly policy evolutions (WH + Fed pivots), with a high probability of recession-evading acceleration into year end. What are the resulting macro trades for Pinebrook?
Long large cap tech – after a cyclical correction, the secular bull is intact.
Short duration – no economic doom, tariff inflation in the pipeline.
Short EURUSD – capital repatriation to U.S. markets after months of outflows.
The Case for U.S. Large Cap Tech
The case for U.S. large cap tech equities starts with a decomposition of performance price action across the major large cap sectors.

Large cap tech was the second worst performing sector of Q1 2025, with the caveat that consumer discretionary is tech-adjacent, with holdings that include Amazon and Tesla and those two companies make up 38% of the ETF weight.
Despite being a lousy performer in Q1 however, large cap tech was the top performer in April, making up all post-Liberation Day losses from the first 5-trading days of the month.
In addition, large cap tech has experienced the biggest outperformance swing since Q1.
Finally, large cap tech’s share of the overall market-cap pie is essentially unchanged from the end of 2024.
The fact that sector market-cap weightings are essentially unchanged on the year suggests that there was no true flight to safety in April. In addition,
Large cap outperformed small caps in April.
High dividend stocks underperformed non-cash stocks.
Momentum stocks, using the MTUM ETF as a proxy, also outperformed in April.
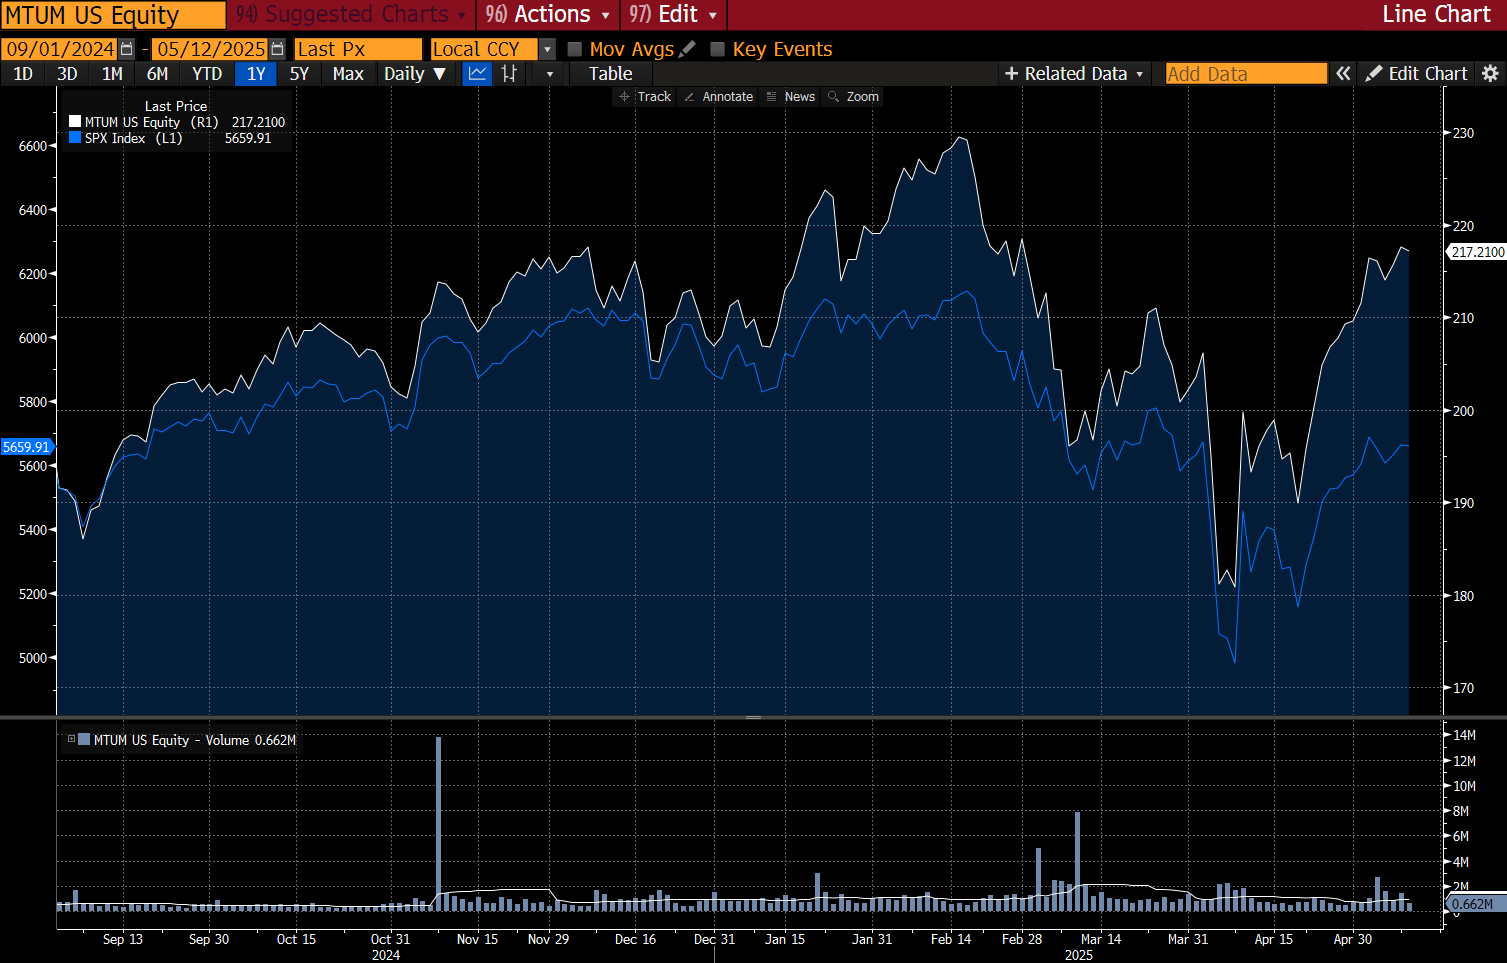
The relative outperformance of large cap tech, momentum, and growth suggests asset repricing as opposed to shifts in investor preferences and allocations within U.S. portfolios. This makes it more likely that large cap tech will remain a sectoral leader in 2025.
This is not to say a slowing economy cannot create headwinds for large cap tech. Shifts in macro are real. The question for investors is whether large cap tech can adapt and evolve to remain competitive in the new macro regime. For now, investors are betting they can.
This bet is not without historical precedent. Putting aside the fact historical 3-month forward returns tend to be lackluster after a 4-standard deviation event in the VIX, context matters.
We know that Trump’s tariff shock was the cause of last month’s market spasm. This makes it very different from prior crisis in this century. In previous crisis, market uncertainty was highly elevated because of a chain of events (financial crisis, pandemic lockdowns) with unknowns. In April, market volatility was the result of one narrow set of polices crafted by essentially one individual.
If U.S. trade policy does not pivot back to the extremes of “Liberation Day”, the VIX should not revisit the 4-sigma level unless we get a new unrelated shock to the system. Now that the market has done its job of pricing the extreme tails of Trump Tariffmania, anything less will be a market yawn within the tariff policy domain.
By focusing on context, investors need not rely on chart-based historical analogs of price action.
If the business cycle stays out of recession and the U.S. economy skirts contraction like how it did in 2022, then Pinebrook’s 1990’s productivity driven boom returns to focus. Recall, this boom was predicated on:
Maintaining full employment (roughly where we are now).
Non-residential investment boom (re-shoring).
Supply Chain (mainly energy) abundance.
A new, non-recessionary, tariff regime while obviously dampen the above growth impulses but not eliminate them. Markets are discounting the tariff regime.
The S&P 500 trades for 21.1x consensus earnings estimates for 2025.
This is much more consistent with past periods of economic optimism (2020 – 2021, 2024) than pessimism (Q4 2018, Q1 2023, 2022, April 2025).
Even at the April lows, the S&P 500 still traded for 18.0x forward earnings, barely below its 10-year average of 18.3x.
With markets looking forward, 2025 is mostly a done deal and 2026 comes into focus.
Current 2026 S&P500 EPS estimates are $300.80 (Factset).
Avoiding recession and the worst of this Administration’s economic governance would likely rerate the market to its prior multiple of 22x and target a calendar year-end S&P500 price in the 6,400 - 6,500 area (22 x 300.8, discounted).
Alternatively, analyst forward EPS estimates are always sus. A spectrum of outcomes is preferred as they provide us with a stylized representation of the possible.
Concluding Remarks
Pinebrook’s modal expectation for the economy has been laid out above.
Policy pivots have closed the recessionary window for now.
The real aggregate payroll and inflation profile argue for continued economic expansion through the summer.
The economy is structurally supported by public-to-private sectoral flows, stimulative tax policy proposals, and a labor market that will likely be able to handle lower NFP prints.
A window of weakness will emerge in late summer, however there is still time for policy to front run that.
U.S. large cap tech remains the preferred habitat for Pinebrook’s equity exposure.
There is likely more room to run in the S&P500 between now and year-end.
Pinebrook is back in risk-on mode.
Cover Art credit goes to @donnelly_brent, used with permission.
Awesome report David-- fantastic.
Thank you David. Very helpful.