

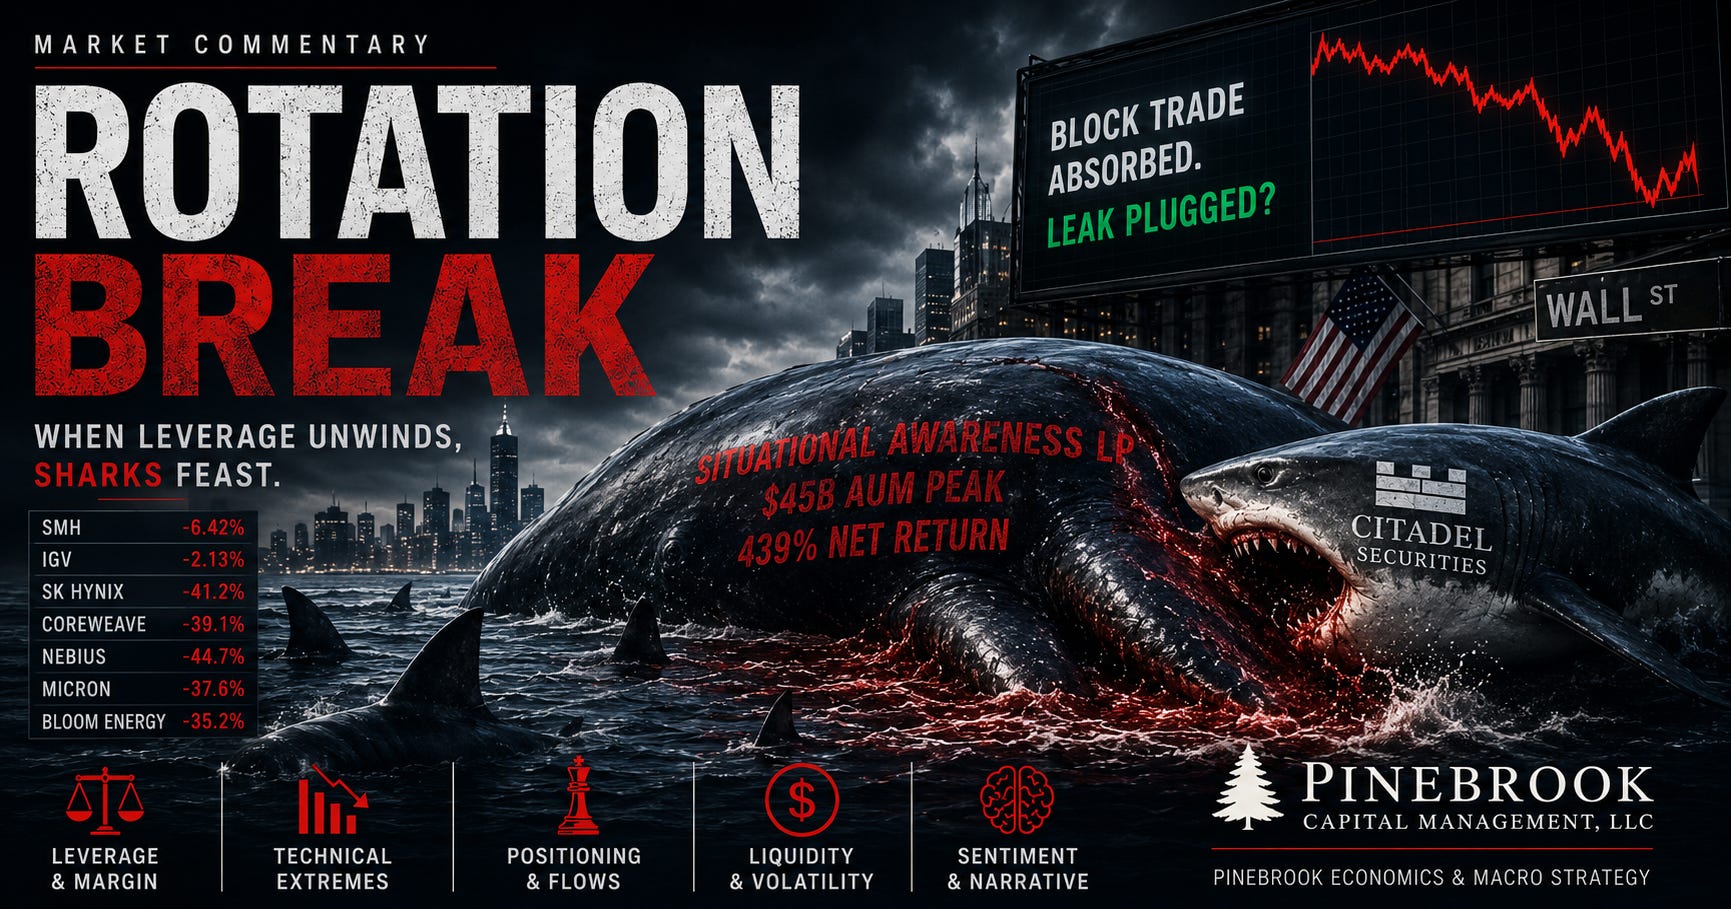
The rotation trade (and trades) flagged here, here, and here took a break today.
The price action appears to be driven by the news that the Situational Awareness Fund, run by Ai Wunderkind Leopold Aschenbrenner, has liquidated its semiconductor and Ai positions in a single block trade to Citadel Securities.
Prelude
Leopold Aschenbrenner’s Situational Awareness LP, a fund that peaked around $45B AUM and was up 439% net through the end of June 2026, got run over in July.
It was carrying roughly 4x leverage on concentrated AI infrastructure and semiconductor longs, hedged with software shorts including Adobe that moved against it simultaneously.
Its core holdings, SK Hynix, CoreWeave, Nebius, Micron, Bloom Energy, fell between 35% and 47% this month, which was enough to wipe out the equity cushion under the borrowed money.
Goldman Sachs, JPMorgan Chase, and Bank of America, its three prime brokers, issued margin calls. Rather than a slow unwind, the fund sold its entire public book, long and short, in a single block trade before market open on July 30.
The fund isn’t dead. It keeps its ~$5B Anthropic stake and continues as a private vehicle.
The consensus seems to be of the view that Citadel has plugged the leak in the sectoral PNL and put a floor on the correction.
Maybe.
The implicit logic here is that a privately brokered agency cross-trade motivates other agents to stop their selling and resume their buying.
Maybe.
There are flaws and unproven assumptions in this thinking.
Agents have homogenous risk positions, and the margin calls are over. No one else is up to their eyeballs in sectoral exposure. ❌
Agents have homogenous risk preferences. Everyone has an appetite for the thing that has come down and turned some PNLs red for the year. ❌
The Citadel bid was at fair market value. ❌
Sharks feasting on the carcass of a whale liquidation is the easiest free money on Wall Street.
Citadel very likely purchased the securities for its center book at a discount, then sold off constituent pieces internally to various pods, at a slight mark-up but still discounted to the Street.
The pods will in turn do what pods do: buy-hold-sell to someone else.
Citadel is a multi-strategy risk manager, not a buy-and-hold conviction investor.
Citadel’s multi-strategy approach and massive risk infrastructure make it uniquely positioned to absorb positions too painful for a more concentrated fund to hold through drawdowns.
That is a statement about balance-sheet capacity, not about Citadel being bullish on the names.
It can hedge, distribute, or unwind pieces of that book on its own timeline without that being publicly visible for weeks (next 13F).
This was a leverage/collateral event, not new information about AI capex, chip demand, or earnings.
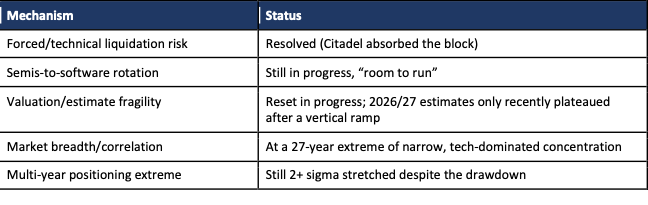
Citadel’s purchase addresses exactly one of these five mechanisms below. The other four are independent of who owns the leveraged book and appear, by the data gathered here, to still be live.
Historically, 2-sigma-plus extremes across 14 years of data have not resolved in days or weeks.
Mere mortals and flies on the ass of an elephant do not know which way the elephant herd will turn next. The whales that sling billion-dollar trades will do what suits them, irrespective of the wishes of mortals and fly-sized market participants.
There are, however, tools that can be used to assess if the selloff is over or is a dead-cat bounce.
Technical
A single block trade absorbed by one large, well-capitalized buyer is mechanically better than a piecemeal forced dump.
A piecemeal liquidation of a position this size, including 8% of Core Scientific’s float, would have meant days of relentless, price-insensitive selling that overwhelms dealer liquidity.
This would drag implied vol higher across the whole complex, and forces sympathetic de-risking from every fund holding overlapping positions.
That tail risk is now off the table.
However, one should not conflate the end of forced selling with a technical and fundamental repricing of assets. They are not the same.
This is where things stand on the technical side of things.
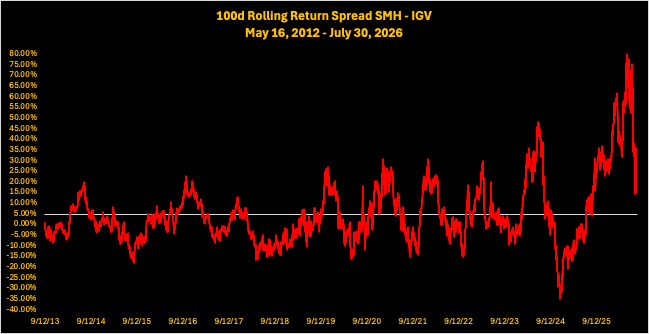
Semis (SMH) outperformed software (IGV) by +84.1 points over the 100 trading days through May 13, 2026. This relative all-time high was more than five standard deviations above the 2012 - 2026 mean of 4.83%.
SMH is currently overbought relative to IGV by 35.49% (as of close July 30, 2026), still more than two standard deviations above the historical mean.
The move is broad, not single-stock: all ten of SMH’s top holdings have fallen since May 13th, while half of IGV’s top ten have risen (Palo Alto Networks, ServiceNow, CrowdStrike leading).
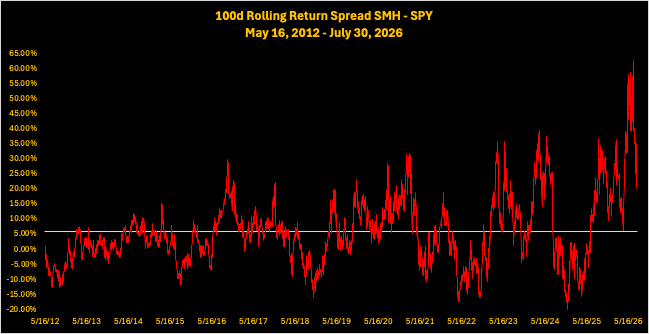
SMH has behaved similarly to the broader market, having fallen from 62.86% overbought (almost 5-sigma) relative to the SPY ETF on June 30th, to just over 2-sigma today at 31.29%.
Fundamental
Putting aside a long list of positive metrics such as valuations and profits, or the AI supercycle, there are two fundamental issues creating uncertainty that remain unresolved by the Citadel purchase.
Analysts’ annual revenue and profit growth estimates for this year and next started moving sideways over the past month or so.
The S&P 500 Semiconductors industry is expected to grow revenues 66.8% this year and 46.9% in 2027.
Expected earnings growth are equally slowing, 107.0% this year and 59.3% in 2027.
To be clear these are phenomenal absolute numbers. But markets do not like flat-line or declining numbers after parabolic spikes.
Thus, the market has stopped giving the industry credit for these growth prospects, and the forward P/E has fallen to 16.6x from north of 30x late last year.
Market Breadth & Correlation
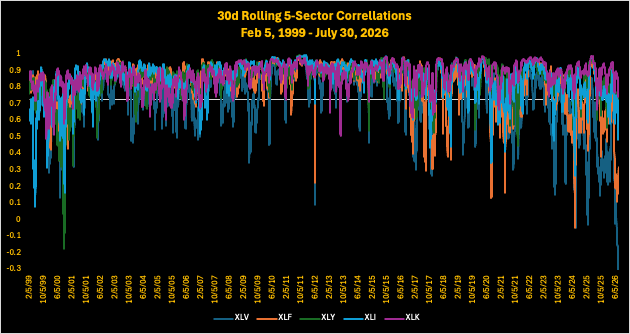
Average correlation of five S&P sector ETFs (XLV, XLF, XLY, XLI, XLK) to SPY has collapsed to 0.41, a 27-year low, 4.07 standard deviations below the historical mean, ranking in the bottom 0.4% of ~6,900 trading days.
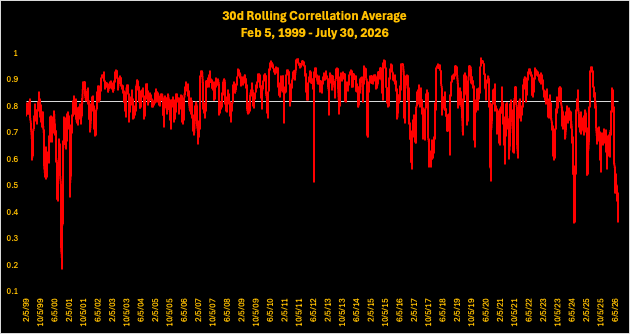
The only comparable prior reading was September 2000, six months into the dotcom unwind and roughly two years before that bear market’s actual bottom.
Health Care has decoupled entirely (correlation to SPY now negative).
Technology alone remains close to its historical norm, consistent with an index whose price action is now dominated by a narrow, AI-exposed complex while the rest of the market goes its own way.
Mean-reversion / z-score analysis (SPY/XLK/SMH/IGV/MTUM, 2012–2026)
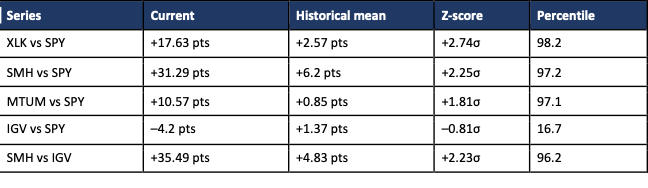
Spot the outlier: The pullback is real but incomplete: the trade remains in roughly the 96th–98th percentile of 14 years of data, not a reversion to the mean. The exception is software, which is oversold relative to the broader market by less than 1-negative standard deviation.
A Historical Comparison to Past SMH Corrections
Number of corrections exceeding 20%: 6, including the current one, which is ongoing and not yet resolved into a new all-time high.
Average trading-day length: 135.7 days including the current episode; 157.6 days across the five completedcorrections (median 187). The current one is only 26 trading days old.
Peak-to-trough decline / duration: Average decline across all six: –31.9%. The current correction (–24.6% over 26 days) is shallower than average and far shorter than any completed episode except the COVID crash (22 days).
Z-score compression (SMH/SPY 100-day rolling relative return): average peak reading +1.16σ, average trough reading –0.72σ, average compression 1.88σ. In all five prior corrections, the z-score crossed into negative territory before the price found its bottom and the relative-outperformance extreme was fully purged. In the current episode, the trough reading (July 29) is still +1.23σ and it has never gone negative. This correction has not yet reached the level of relative-strength exhaustion that has marked every prior bottom in this dataset.
Percentage distance from 200-day moving average, peak to trough: average peak was +29.5% above the 200dma, average trough was –15.8% below it. In all five prior corrections, price eventually fell below the 200dma. In the current episode, the trough is still +12.4% above the 200dma — again, the one correction in six that hasn’t reached the depth of every historical precedent.
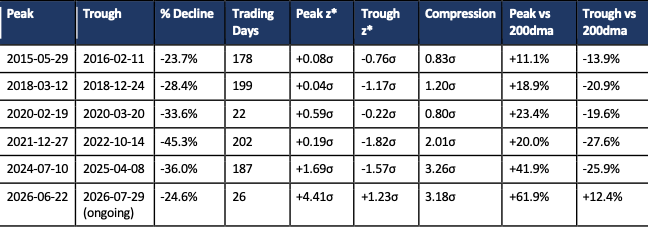
*Peak/Trough z-score = SMH-vs-SPY 100-day trailing relative return, standardized against its full-history mean (6.20%) and population std dev (11.57%), n=3,571 trading days, 2012-05-16 to 2026-07-30.
Averages: decline -31.9%; duration 157.6 trading days (5 completed episodes) / 135.7 including the ongoing 2026 episode; peak z +1.16σ → trough z -0.72σ (compression 1.88σ); peak 200dma distance +29.5% → trough -15.9%.
Concluding Remarks:
This was a leverage/collateral event, not new information about AI capex, chip demand, or earnings.
Technical tail risk has been removed from the market.
SMH remains 2-sigma overbought relative to SPY and IGV.
Analysts’ annual revenue and profit growth estimates for this year and next have plateaued, for now.
Market sectors have become extremely uncorrelated.
By decline magnitude, duration, relative-strength exhaustion, and 200dma undershoot, this correction is running shorter and shallower than every completed 20%+ SMH correction since 2015 and specifically, it hasn’t yet hit the exhaustion signatures (negative z-score, sub-200dma price) that have marked every prior bottom.
This article is so good. Really so good. Haha. Because just a few minutes ago, I happened to be thinking that maybe today's sell-off was precisely caused by this matter of his. And then I saw your article come out. Hahahaha. Awesome!
Thank you for your insight on the recent excitement! Retail monkey question: You write a lot about sector/asset correlations and deviations from norms - Do the “whales” watch these similarly and trade on them?