

On June 8th, these pages flagged a rotation in the making by examining the correlation footprints of the five of the eleven largest sectors that make up the S&P500. At the time, healthcare and financials were breaking out and tech was being repriced. The market as whole has continued to shrug it all off.
Here is what the performance scorecard looks like since June 2nd, the day XLK peaked, through July 10th.
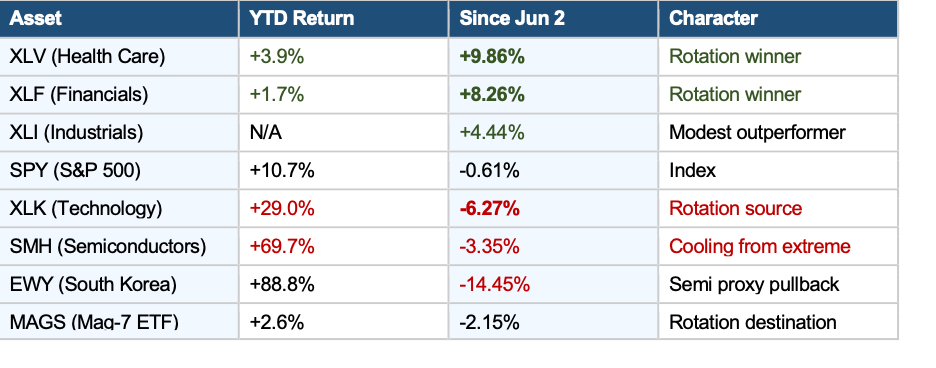
The rotation is no longer a speculative theory.
There is a nearly 1,600 basis points of spread between the best and worst sectors since the semi peak (XLV vs. XLK).
That is not noise. It is a shift within the current bull market.
In the June 8th note, the 5-sector 30-day rolling correlation average vs. the S&P500 stood at 0.491, which was described as -3.58σ below the post-2018 mean. It was flagged as one of the most extreme readings in the 27-year dataset outside specific market dislocations.
There was an underestimation in how much further it would go.
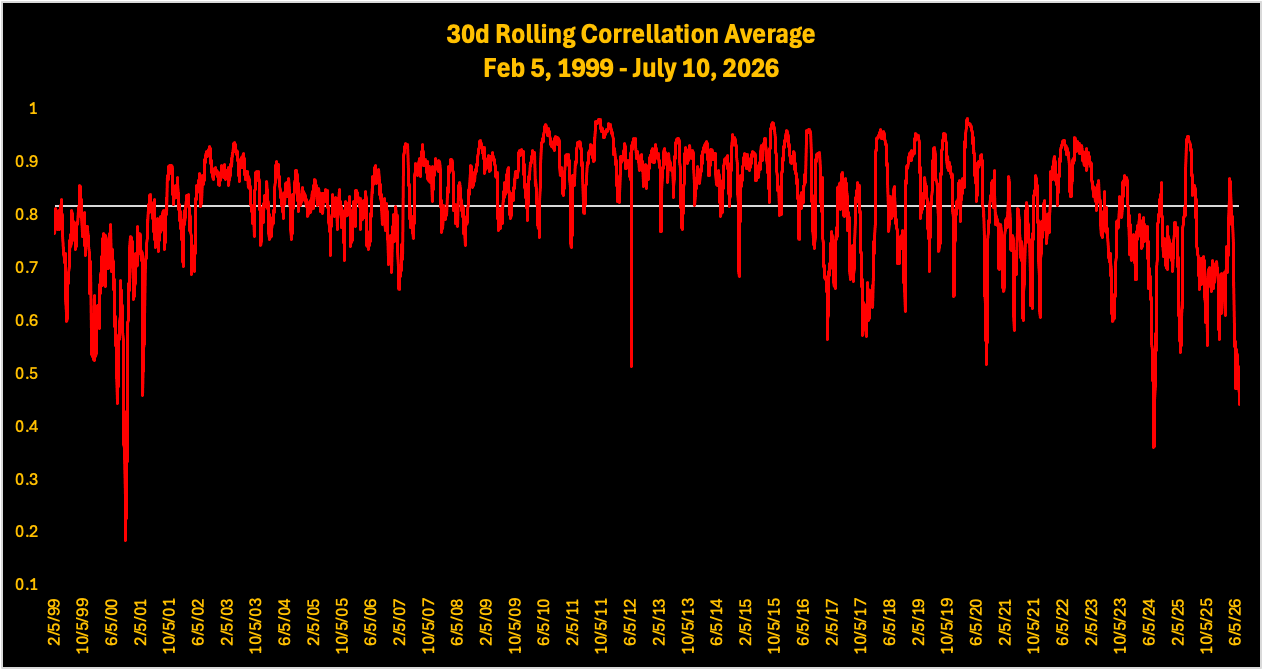
As of close on July 10th, the composite correlation average stands at 0.456.