
Market Commentary
Anatomy of a Non-Panic and Resulting Footprints

On Friday, June 6th, the S&P 500 Technology sector ETF, XLK, fell -6.66%. The S&P 500 fell -2.58%. Health Care (XLV) rose +0.61%. Financials (XLF) rose +0.21%. The spread between the best and worst sector on the day was 727 basis points.
The market did not panic. It rotated.
Friday’s catalyst was the May jobs report: 172,000 jobs added, with net upward revisions of 93,000 to prior months. The three-month average rose sharply to 188,000. It was the third strong report in a row.
A strong jobs print with upward revisions does one thing above all else in the current environment: it raises the probability of a hike not only of one hike, but of multiple hikes this year.
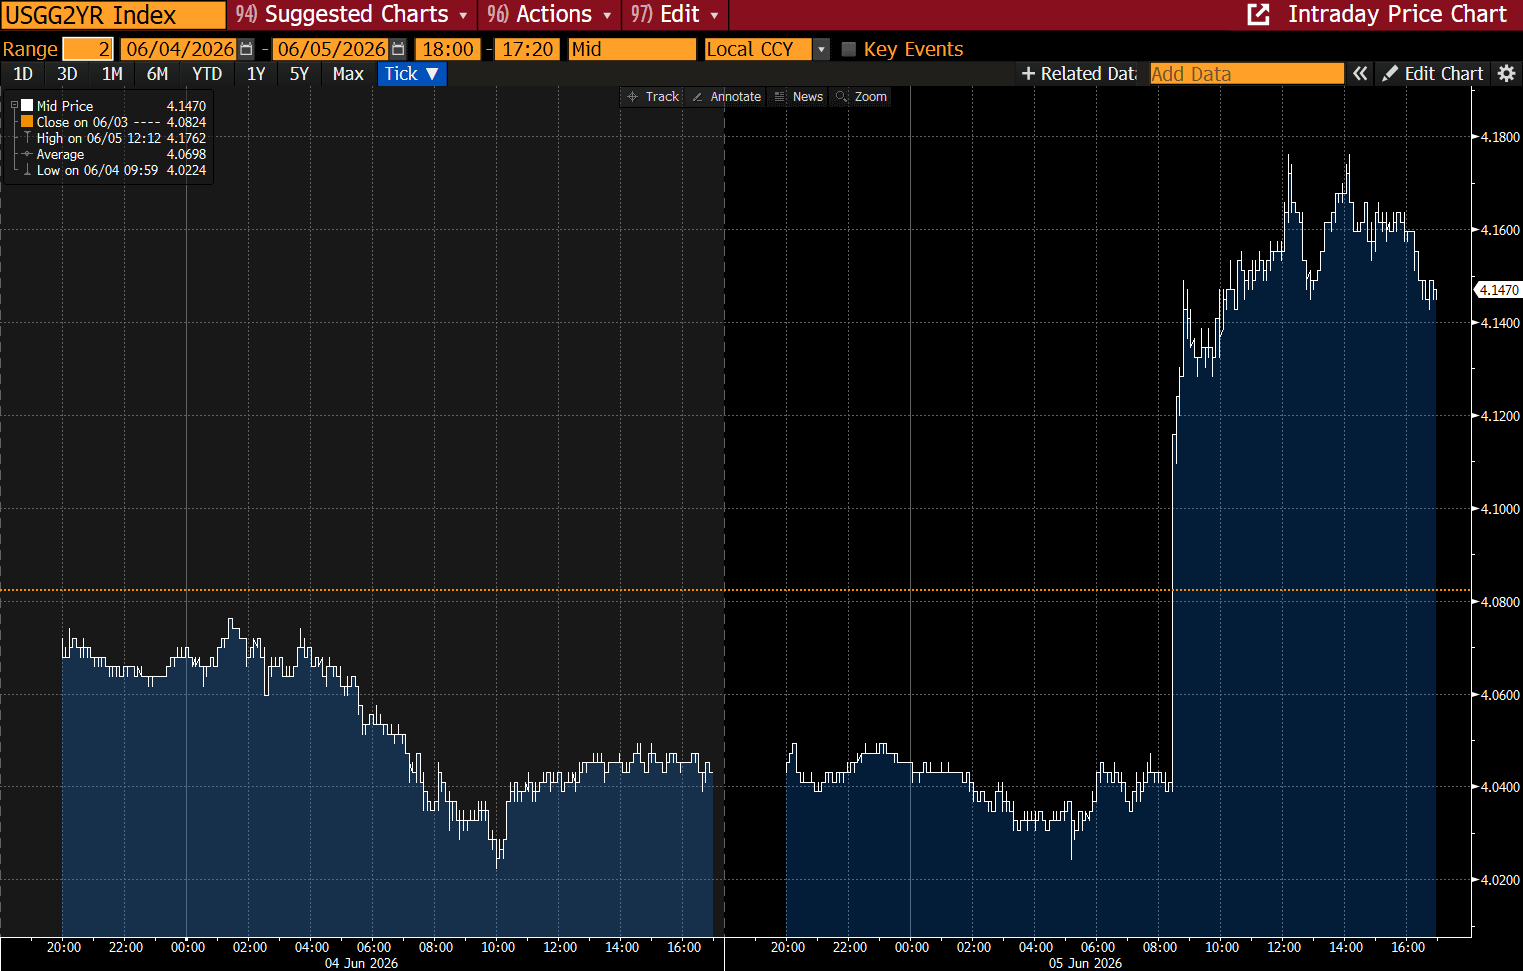
The 2-year Treasury, already at 4.04% heading into the number, and gapping up to 4.14%, tells the story.
The sector breakdown of Friday’s price action is worth examining in detail:
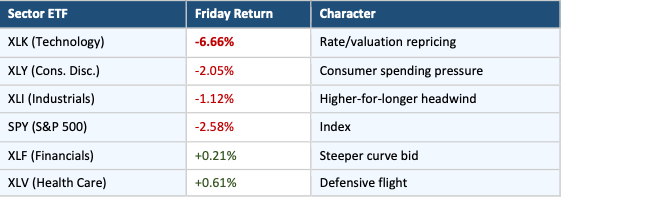
In a genuine risk-off event, all six of those rows are red. The fact that XLV and XLF held positive on a day the index dropped 2.58% tells you this was a Tech-specific repricing, not a macro panic.
The weekly numbers confirm it:
Health Care rose 2.37%.
Financials rose 1.4%.
Consumer Discretionary fell 4.97%.
Industrials were up .61%
IT fell 5.61%.
Three out of five sectors were up on the week. The market is reassigning capital.
For a sector ETF of XLK’s size and liquidity, -6.66% in a single session is a huge cyclical move. The AVGO contagion, the payrolls catalyst, and the rate repricing all hit simultaneously. Whether Friday was capitulation or the beginning of a more sustained drawdown is the central question heading into the week.
XLK has retraced a meaningful portion of its 55.45% rally from the March 30th trough to the June 2nd peak.
Now at a 41.41% advance as of June 5th.
One of the most important data points this week received the least attention:
Year-to-date through Friday, the Roundhill Magnificent Seven ETF (MAGS) is up just 0.83%.
The S&P 500 excluding the Mag-7 (XMAG) is up 9.87% YTD.
The cap-weighted S&P 500 ETF (SPY) is up 8.16% YTD.
The equal weighted S&P ETF (RSP) is up 8.49%.
The other 493 stocks in the S&P 500 are collectively outperforming the seven largest companies by roughly 900 basis points year-to-date and helps to validate the rotation call.
Does This Look Like 1999?
A reader posed this directly: what did this look like in the 1999-2001 rotation? Does some level of concentration necessitate rotation equals selloff?
We now have 27 years of daily data on all five sector ETFs — XLV, XLF, XLY, XLI, and XLK (all launched December 22, 1998) — which allows a proper apples-to-apples comparison. The answer requires going sector by sector, not relying on the composite.
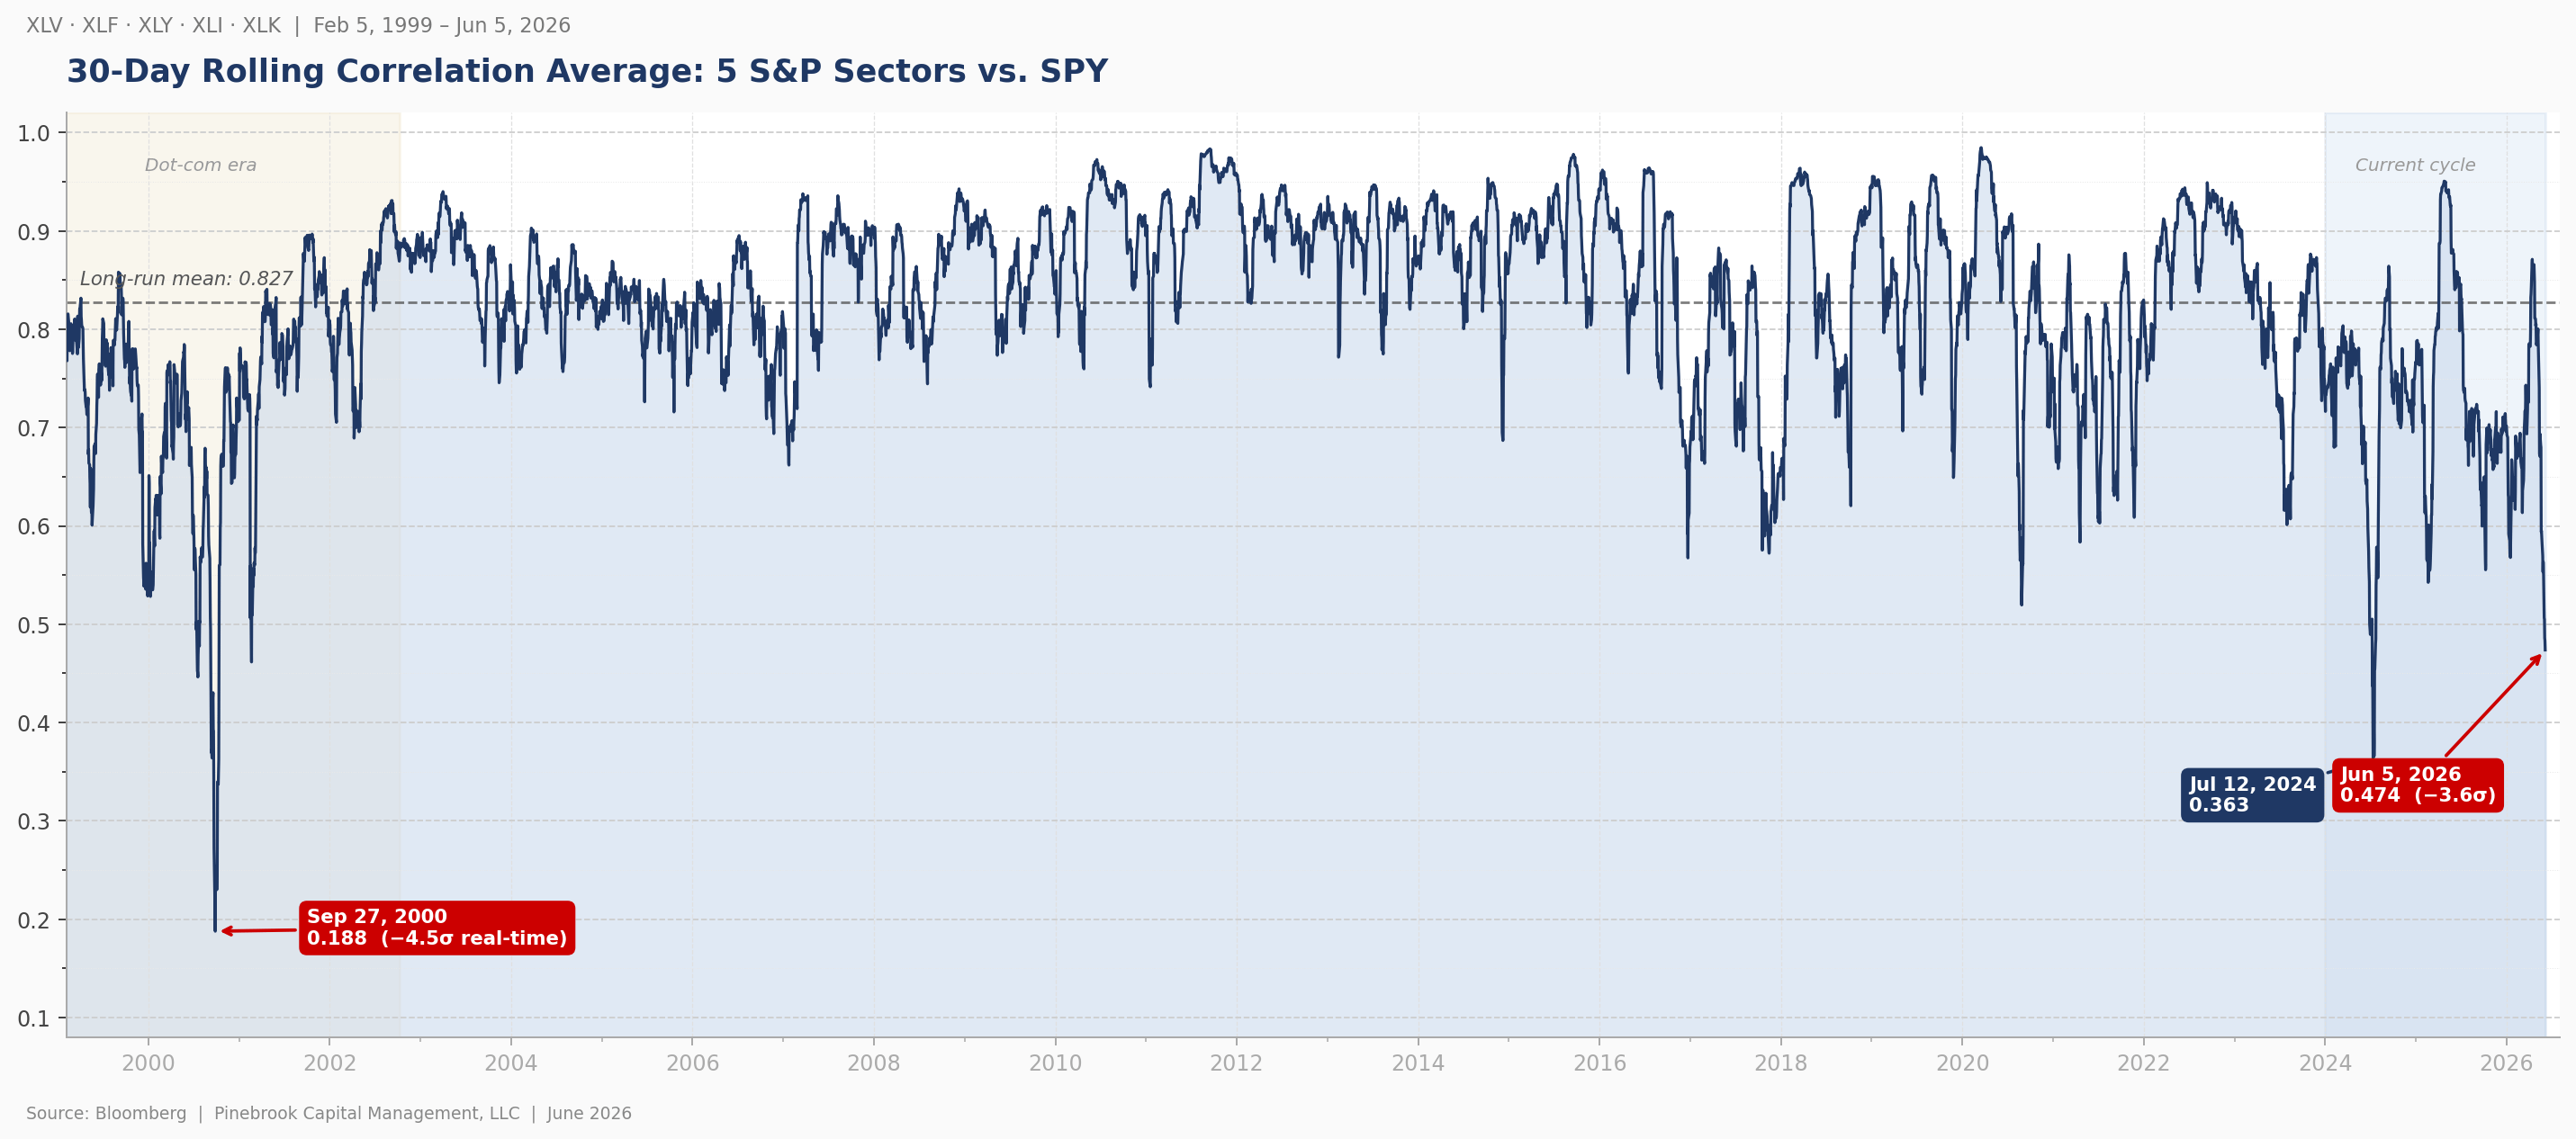
Chart 1: 30-day average rolling correlations of all five sectors vs. SPY, full 27-year history. Note the September 2000 trough at 0.188 — visually in a different universe from Friday’s 0.474.
The two eras share a striking structural resemblance at the regime level.
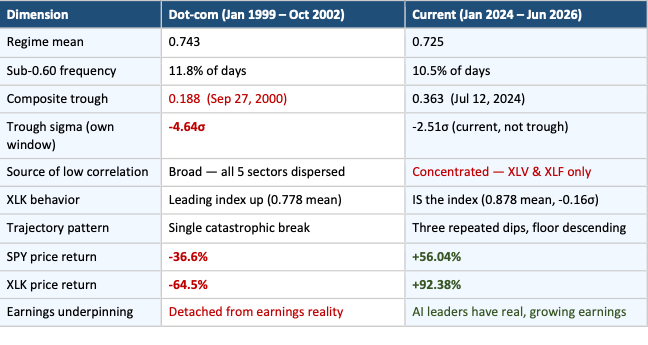
The dot-com full cycle (Jan 1999 – Oct 2002) ran a mean 5-sector correlation of 0.742.
The current cycle (Jan 2024 – Jun 2026) is running at 0.725.
Within rounding, they share the same low-correlation environment. The frequency of sub-0.60 readings is also nearly identical: 11.8% of trading days in the dot-com window, 10.5% in the current window. These are the only two sustained low-correlation regimes in the 27-year dataset.
While the composite average looks similar between the two eras, the individual sector lines tell a completely different story. In 1999-2000, all five sectors were dispersing from the index simultaneously — a broad market-wide phenomenon driven by investors making confident sector-level bets across the entire index.
Today, three of the five sector lines are clustered relatively tightly. The anomaly is concentrated in two sectors: XLV and XLF.
Chart 2: 30-day rolling correlations for each of the five sectors vs. SPY, full 27-year history. The dot-com era (amber) and current cycle (blue) are the only two sustained low-correlation regimes.
The Structural Differences — Four of Them
1. Sigma extremity. Against the dot-com window’s own mean and standard deviation, today’s composite reading of 0.474 is -2.51σ. The September 27, 2000 trough of 0.188 was -4.64σ against that same window — and against data known in real time at that moment, approximately -4.5 to -5σ. The chart makes this point better than any number: the September 2000 collapse is nearly off the bottom of the page. We are not there. We are not even close to there.
2. Source of the low correlation. In 1999-2000, sector mean correlations ranged from 0.615 (Industrials) to 0.778 (Tech) — a tight cluster, all sectors participating. Today, XLK at 0.878 is tightly fused to the index. The low-correlation reading is driven almost entirely by XLV and XLF. Strip those two out and the remaining three sectors are running at normal-to-elevated correlations. This is a two-sector anomaly, not a market-wide one.
3. Trajectory pattern. The dot-com regime produced a single catastrophic break — a near-vertical collapse to 0.188 in September 2000, followed by a snap recovery within weeks. The current cycle has produced three distinct dips below 0.60: July 2024 (monthly average 0.479), February 2025 (0.593), and now June 2026 (0.491). Each has recovered. But the recoveries are getting shallower and the floor is gradually descending. Repeated shallow dips suggest rotation. A single violent break suggests dislocation.
4. Market return context. SPY price return during the dot-com full cycle (Jan 2, 1999 – October 9, 2002): -36.66%. XLK: -64.5%. SPY total return in the current cycle (January 2, 2024 – June 5, 2026): +56.04%. XLK: +92.38%. Same low-correlation regime signature. Completely opposite market outcomes. The dot-com bust was caused by valuations completely detached from earnings reality. The AI trade today is led by companies with real, growing, massive earnings.
Direct answer to the reader’s question: