

EXECUTIVE SUMMARY
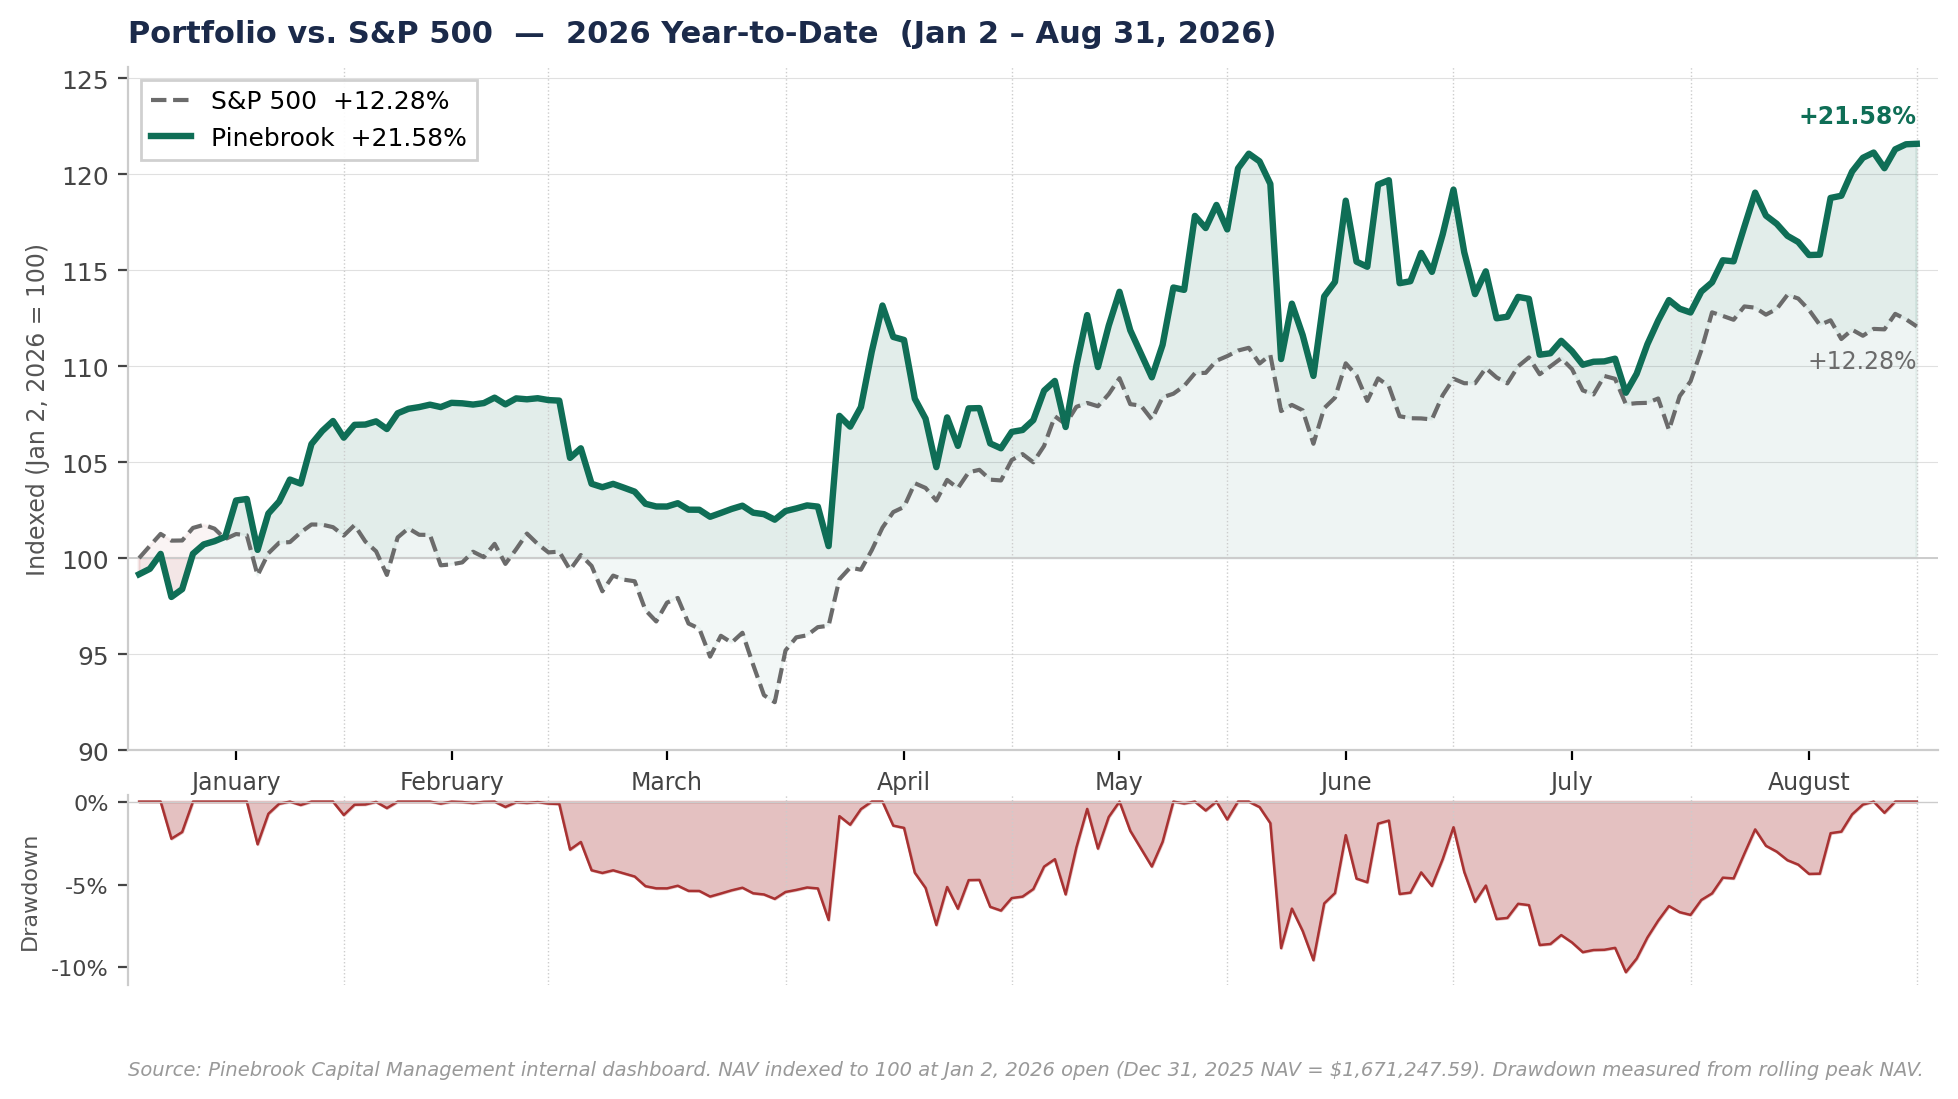
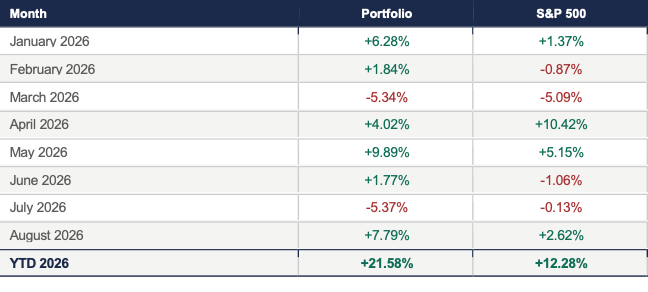
Pinebrook generated a +21.58% return for the period January 2 through August 31, 2026, against an S&P 500 return of +12.28%, for a spread of +9.30%.
August produced a +7.79% return against the S&P 500’s +2.62%. This was the second-best monthly alpha of the year at +5.17%.
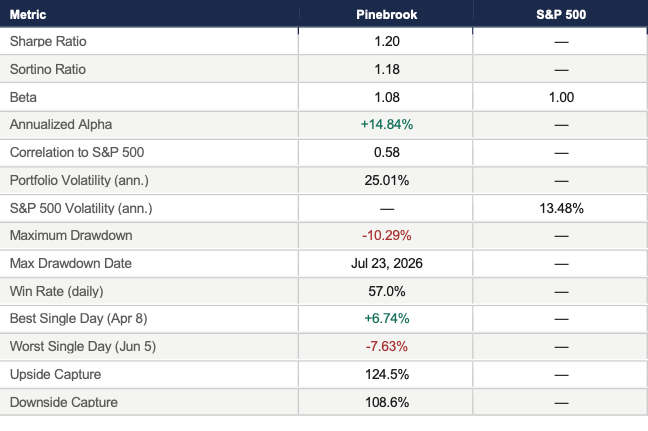
The result directly validates the July 13–16th repositioning. YTD risk metrics have recovered materially from the July trough: Sharpe 1.20 (up from 0.83), Sortino 1.18 (up from 0.81), downside capture 108.6% (down from 120.3%).
EQUITY CURVE VS. S&P 500
PERFORMANCE SNAPSHOT

RISK METRICS — YTD THROUGH AUGUST 31
MONTHLY RETURN BREAKDOWN
MONTHLY RISK METRICS — 2026 (PART I)
Return, Sharpe, Sortino, Beta, Alpha, Correlation by month. Each month standalone. June and July shaded. Sharpe/Sortino: green ≥2.0 amber ≥1.0 red <0

Alpha is annualized Jensen’s alpha. April’s -196.8% reflects underperformance vs beta-adjusted benchmark (beta 2.12, SPX +10.42%). Single-month alpha is sensitive to beta estimation over short windows.
MONTHLY RISK METRICS — 2026 (PART II)
Volatility, drawdown, win rate, capture ratios, best and worst days by month.

Max DD per month measured from rolling peak within that month. August downside capture of -22.7% reflects a month with very few down days for the portfolio vs. the market — directionally a strong result, but the sign artifact is a function of the portfolio falling less than the benchmark on negative SPX days.
PORTFOLIO COMMENTARY
January – July: Summary
The portfolio delivered five positive months from January through June, with March (-5.34%) and July (-5.37%) as the two down months. The H1 2026 Performance Report and the July 2026 Performance Report address each period in detail, including the concentration risk that drove June and July’s deteriorating risk metrics and the corrective repositioning executed July 13–16th.
August: +7.79%
August was the portfolio’s strongest month on a risk-adjusted basis, producing a +7.79% return against the S&P 500’s +2.62% for a +517 basis point spread. The monthly Sharpe of 6.27 and Sortino of 9.94 reflect both the strength of the return and its consistency — the portfolio won 66.7% of trading days with a best day of +2.55% and worst day of -1.01%.
The primary drivers were GDX and GDXJ (combined +$32,350 from entry across all four tranches as gold continued its run), IGV (+$32,006 from the July 16th entry), TSM (+$23,095), and the GEV and CAT short positions (+$12,822 and +$13,266 respectively) as industrial machinery underperformed.
EWJ short (combined -3,980 shares) remained the primary drag, down approximately -$24,000 for the month as Japanese equities continued to strengthen. The DXJ long partially offset this through the pairs structure, but the net Japan position was a headwind. KWEB long was also a small drag (-$2,775 on the 3,384 share position closed August 21st) as Chinese internet names softened late in the month.
Seven positions were closed on August 21st: SPHR (+$14,115), LYV (+$7,778), FEZ (+$3,654), EPOL (+$11,819), FXI (+$3,543), MCHI (+$2,584), and KWEB (-$2,775). Combined realized gain from these closures: +$40,718. The remaining book heading into September is more concentrated in the gold miners, the Japan pair, IGV, TSM, and the GEV/CAT industrial short basket.
ON THE RISK METRICS
The monthly metrics matrix tells the August story directly. The two-month anomaly of June (Sharpe 0.59) and July (-3.37) has been followed by the portfolio’s strongest risk-adjusted month of the year. The July report stated that whether the repositioning was sufficient would be visible in the August numbers. It is.
YTD metrics have recovered across every dimension: Sharpe from 0.83 to 1.20, Sortino from 0.81 to 1.18, downside capture from 120.3% to 108.6%, annualized alpha from 8.02% to 14.84%. The maximum drawdown of -10.29% (July 23rd) remains in the YTD series and will continue to roll off as the portfolio builds on the August result. Beta has compressed from 1.13 to 1.08 and correlation from 0.60 to 0.58, consistent with the repositioned book running less single-factor exposure than the June–July peak.
TRACK RECORD
Portfolio performance since inception in August 2024.
