

EXECUTIVE SUMMARY
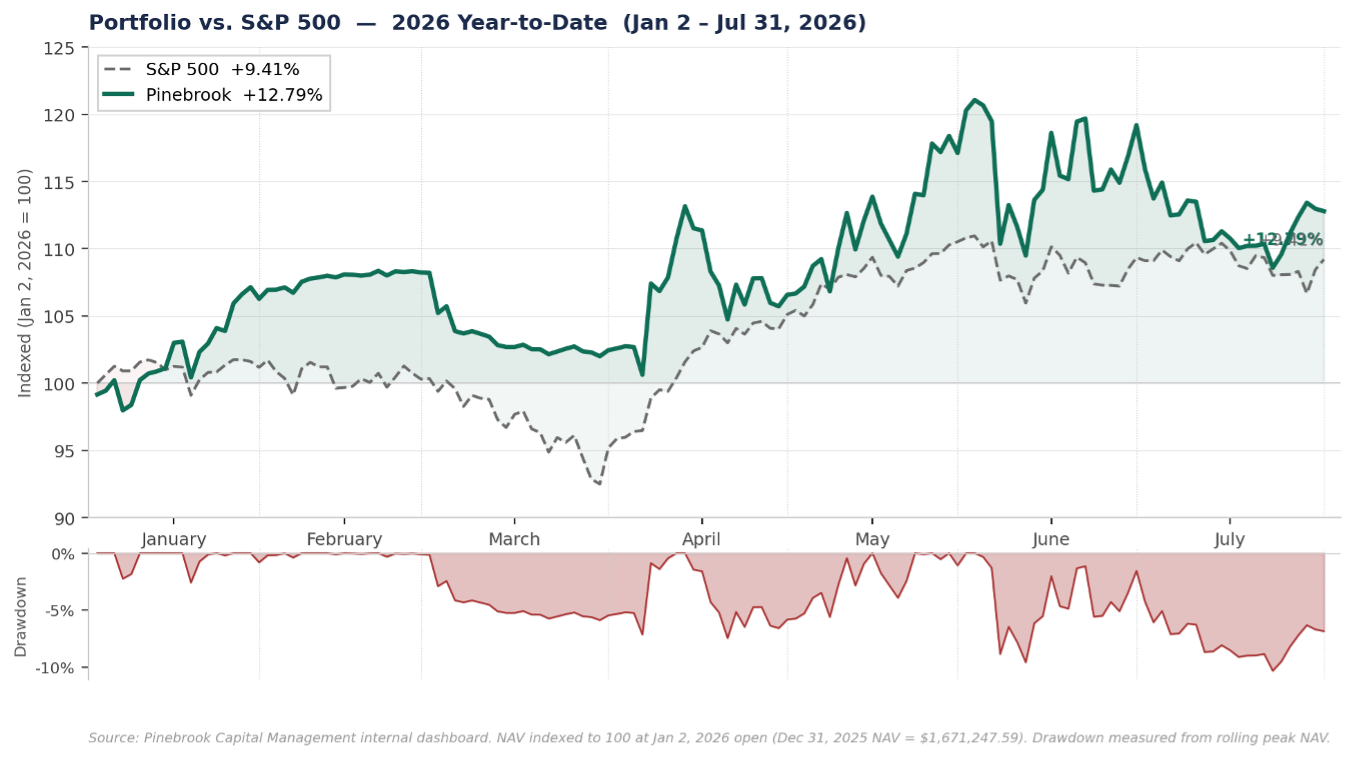
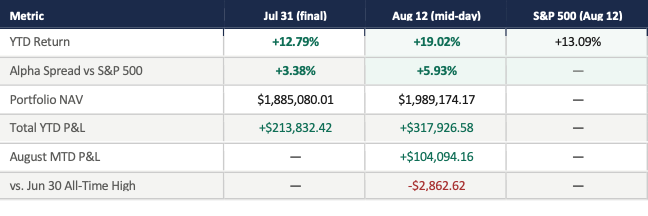
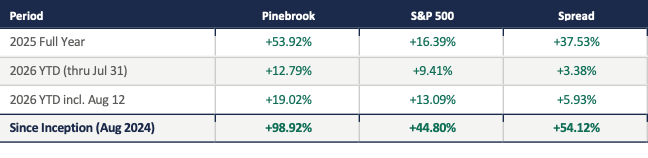
Pinebrook generated a +12.79% return for the period January 2 through July 31, 2026, against an S&P 500 return of +9.41%, for a spread of +3.38%.
July was the portfolio’s second down month of 2026, declining -5.37% against a flat S&P 500 (-0.13%). The loss was driven by concentrated exposure to the AI/semiconductor/Korea complex during the first half of the month.
A rotation on July 13 - 16th addressed the concentration directly. Through midday August 12th (13 trading days into the new month) the portfolio has returned +5.52% against the S&P 500’s +3.36%, recovering the bulk of July’s loss and approaching the June 30th all-time high.
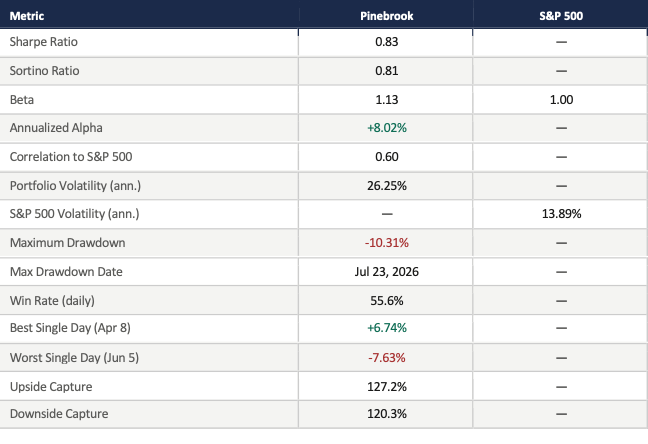
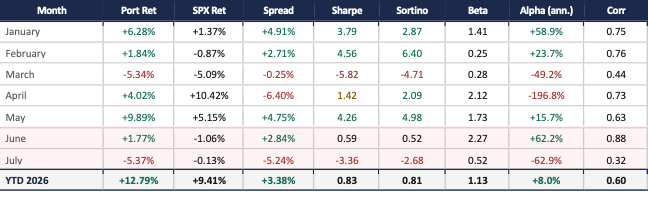
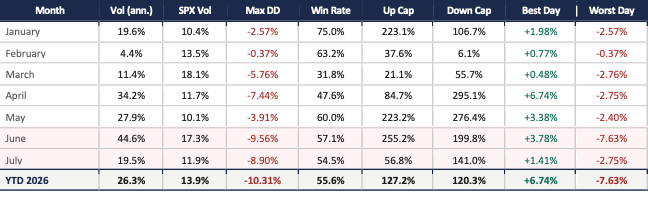
YTD Sharpe of 0.83, Sortino of 0.81, and downside capture of 120.3% reflect the accumulated cost of the June and July concentration period.
The monthly breakdown in the tables below shows these metrics in full by month; January, February, and May - Sharpe 3.79, 4.56, and 4.26 respectively - represent the baseline. June and July are the anomaly.
EQUITY CURVE VS. S&P 500
PORTFOLIO COMMENTARY
January – June: Summary
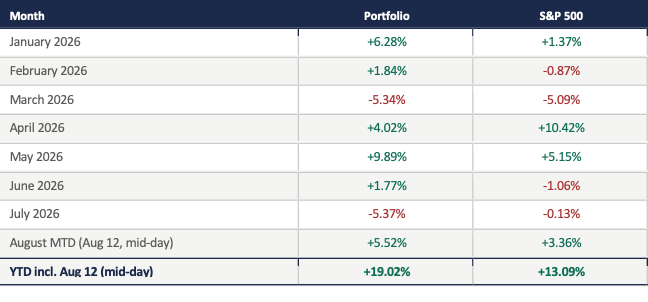
The portfolio opened 2026 with two months of consecutive gains before its first down month in March. January (+6.28%) and May (+9.89%) were the standout months, with February (+1.84%), April (+4.02%), and June (+1.77%) each contributing positive spreads against the benchmark.
March (-5.34%) tracked the S&P 500 closely on a broad risk-off move.
Full commentary on the January through June period is available in the H1 2026 Performance Report.
July: −5.37%
July was the portfolio’s sharpest monthly drawdown of 2026, declining -5.37% against an essentially flat S&P 500 (-0.13%), producing -524 basis points of negative spread. The month had two distinct phases separated by a major book rotation on July 13 through 16th.
Phase one (July 1–12): The China short positions (MCHI, FXI, KWEB) were closed July 1st at a combined gain of approximately $28,000. EFA and IEUR short legs were closed July 6th at a small loss. The remaining concentrated positions in EWY, TSM, SMH, QQQ, and XLK faced a sharp sector rotation. SMH fell approximately 10% through the first two weeks of July; EWY fell over 14%; TSM declined roughly 15%. These positions, held in size since April and May, drove the bulk of July’s loss.
Phase two (July 13 - 16): EWY sold in two tranches, 310 shares on July 13th at $171.61 and 628 shares on July 16th at $163.36, both realizing substantial gains from the April 7th entry at $133.34 despite the July drawdown. SMH, EMXC, QQQ, and XLK longs closed. Rebuilt into: long FEZ (European equities), long EPOL (Poland), long MAGS (Magnificent 7 basket), long DXJ / short EWJ (Japan pair), short XLK vs. long MAGS (sector hedge), short GEV and CAT (industrial machinery), additional GDX/GDXJ, and long FXI/MCHI/KWEB (China thesis reversed from short to long on July 16th).
August MTD (through August 12): +5.52%
Through midday August 12th the portfolio has returned +5.52% against the S&P 500’s +3.36%. Primary contributors: GDX/GDXJ (+$22,936 combined from entry), TSM (+$28,386), SPHR (+$23,352), EPOL (+$12,172), DXJ/FEZ Europe long (+$30,436 combined), CAT short (+$6,938). Primary drag: EWJ combined short (-$29,100) as Japanese equities have continued to strengthen against the thesis. MAGS/XLK pair is flat (+$3,024 / -$11,360 net -$8,336) functioning as a sector hedge.
ON THE RISK METRICS
The tables above show every metric for every month. The numbers are what they are.
January (Sharpe 3.79), February (4.56), and May (4.26) are the Pinebrook standard. June (0.59) and July (-3.36) are the cost of running a single-factor book for too long.
The June report flagged thematic concentration as a known risk and committed to addressing it. July is what happens when that correction is delayed.
The numbers that are bad: downside capture 120.4% (portfolio drops harder than the market on down days), YTD Sortino 0.81 (downside-adjusted returns barely positive), July Sharpe -3.36 (a month that destroyed risk-adjusted performance).
The number that is defensible: annualized alpha remains +8.02% YTD and the since-inception spread is +54.12 percentage points.
The corrective action came July 13th. The August data shows it is working.
PERFORMANCE SNAPSHOT
RISK METRICS — YTD THROUGH JULY 31
MONTHLY RETURN BREAKDOWN
MONTHLY RISK METRICS — 2026 (PART I)
Return, Sharpe, Sortino, Beta, Alpha, Correlation by month. Each month standalone. June and July shaded. Sharpe/Sortino: green ≥2.0 amber ≥1.0 red <0
MONTHLY RISK METRICS — 2026 (PART II)
Volatility, drawdown, win rate, capture ratios, best and worst days by month.
TRACK RECORD
any plans or ideas for how to deal with single factor overstays or how to reduce vol?