

EXECUTIVE SUMMARY
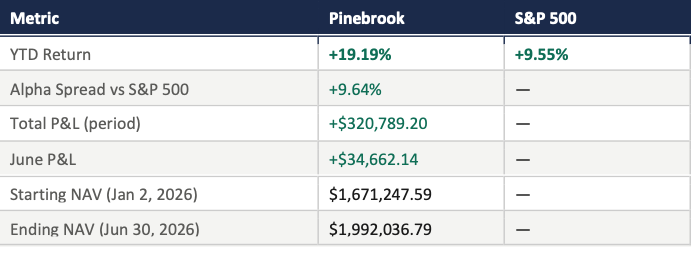
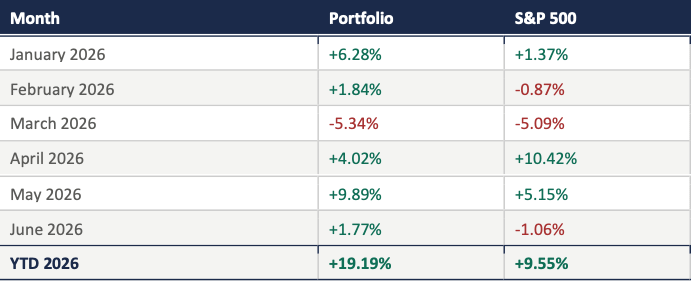
For the month of June 2026, Pinebrook generated a return of 1.77% versus a loss of -1.06% for the S&P500; an outperformance spread of 284-basis points.
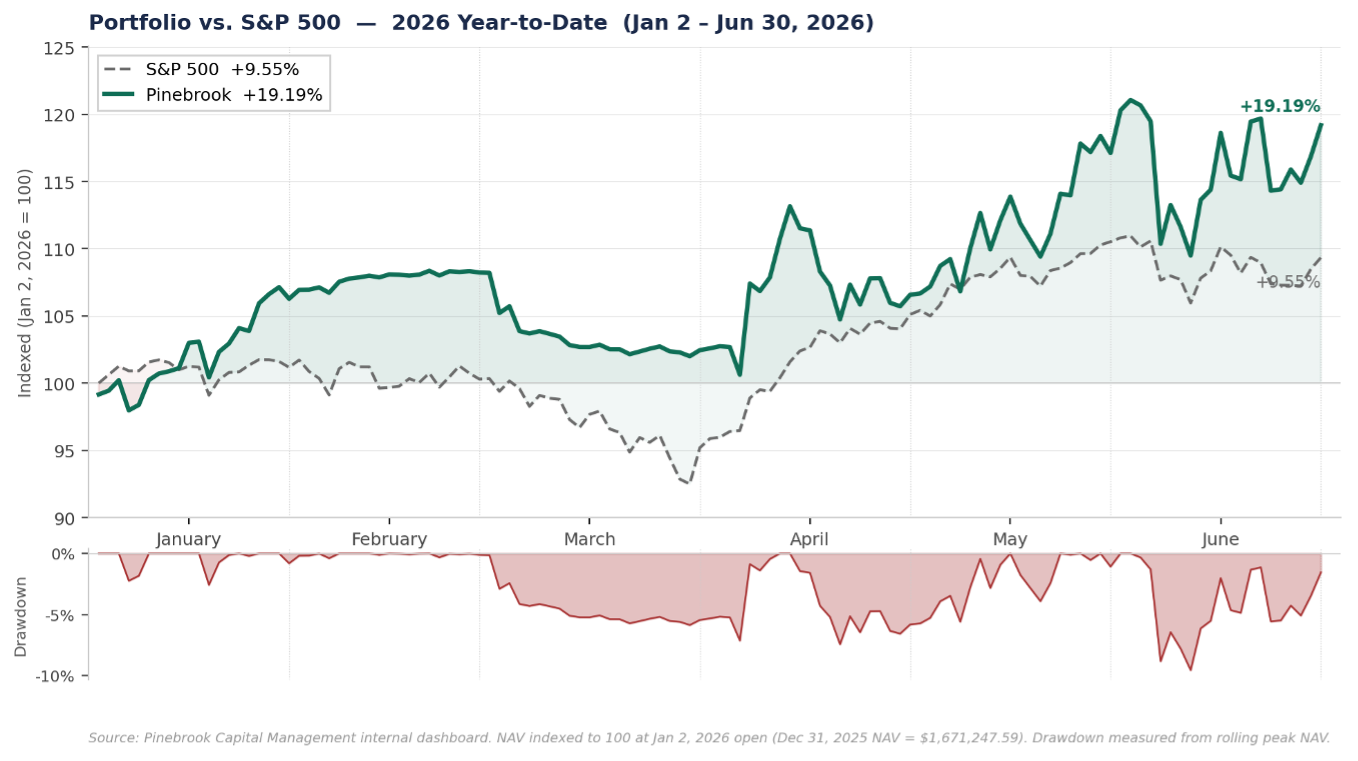
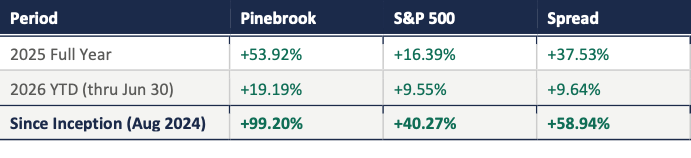
YTD for H1 2026, Pinebrook has generated a return of +19.19%, against a S&P 500 return of +9.55% — a spread of 964-basis points.
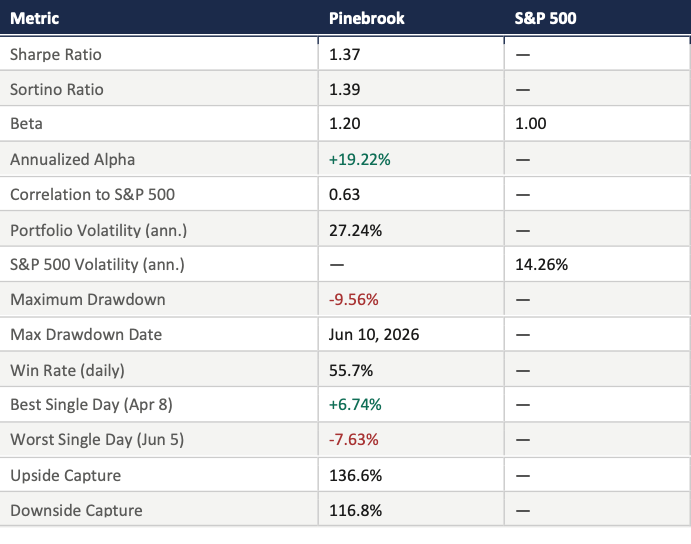
On a risk-adjusted basis, the portfolio produced a Sharpe Ratio of 1.37 and a Sortino Ratio of 1.39.
The H1 maximum drawdown was -9.56%, and the peak-to-trough window ran from May 29th through June 10th, with the book recovering to new highs by mid-June.
The local peak to trough drawdown for the month of June took place between June 2nd and June 10th.
Beta of 1.20 and correlation of 0.63 reflect a concentrated, directional book with meaningful but selective market exposure.
Upside capture of 136.6% and downside capture of 116.8% — combined with an annualized alpha of +19.22% — reflect a portfolio consistently generating returns independent of broad market direction.
The last two points reflect a deterioration in risk metrics from the prior month, discussed below.
PERFORMANCE SNAPSHOT
RISK METRICS
MONTHLY RETURN BREAKDOWN
COMMENTARY
January – February: +6.28% / +1.84%
The book opened the year decisively, posting +6.28% in January and +1.84% in February against a flat-to-negative S&P 500. The primary driver in January was a concentrated position in Korean equities via EWY — entered at $104.27 and closed January 30th at $123.96, an 18.9% return on the position. DXJ, capturing yen-weakening dynamics, contributed an 8.9% gain and was exited in mid-February. Silver micro-futures provided an additional non-correlated contribution in late January and early February, contributing approximately $40,000 in combined PNL. The cumulative effect was a +8.26% portfolio gain through the first two months against the S&P 500’s +0.48%.
March: −5.34%
March was the book’s weakest month, declining -5.34% against the S&P 500’s -5.09%, a -25 basis point negative spread. A cluster of position unwinds — KRE, WNC, RSP, EWU, and DXJ — moved against the book simultaneously during a period of broad risk-off positioning driven by tariff uncertainty. The near-parity with benchmark performance reflects the portfolio’s genuine equity character; broad sell-offs correlate across the book.
April – Ceasefire Announcement: +4.02%
April produced a net gain of +4.02% despite containing the period’s maximum drawdown event. On April 7th the portfolio reached its intra-period trough, driven by GDX/GDXJ long exposure and crude oil futures positioning ahead of the Ceasefire Announcement. April 8th produced the period’s best single day at +4.88% as ES and NQ futures captured the market reversal. The April 9–10 cluster — long-biased futures and long EEM — produced additional gains as global equities recovered sharply. The S&P 500’s +10.42% headline April gain was driven primarily by the post-announcement snapback; Pinebrook’s +4.02% reflects entry positioning that was partially caught in the initial drawdown.
May: +9.89%
May was the strongest single month at +9.89%, outperforming the S&P 500’s +5.15% by 474 basis points. Semiconductor exposure via SMH, clean energy positions (QCLN, PBW), and broad emerging market participation through EMXC were the primary contributors. Short positions in EIDO and INDA also contributed positively as those markets underperformed.
June: +1.77%
June produced a +1.77% gain against the S&P 500’s -1.06%, a +284 basis point spread and the second-best monthly alpha of the year. The month was characterized by strong cross-asset dispersion: open long positions in EWY, TSM, SPHR, and SMH drove gains, while China shorts (MCHI, FXI, KWEB) contributed a combined $26,000 as Chinese equities softened. XLE, OIH, QCLN, and PBW were closed mid-month on June 18th. The ESM6 carry position was closed June 15th at a gain, with the ESU6 roll entered same day finishing the month modestly below entry.
The month’s defining session was June 5th, which produced the period’s largest single-day drawdown. The catalyst was a strong May jobs report — 172,000 jobs added with 93,000 in upward revisions — that sharply repriced rate-cut expectations and triggered an aggressive selloff in rate-sensitive technology and semiconductor names. XLK fell 6.66% on the session; EWY fell 14.1% as Korean semiconductor names bore the brunt of AVGO-driven contagion. The portfolio’s concentrated exposure to that trade — EWY, SMH, and ESM6 futures each representing a variant of the same AI/semiconductor position — amplified the impact.
The session is best read as a rotation event rather than a risk-off episode. XLV and XLF both closed positive on the day the S&P fell 2.58%, and three of the five major S&P sectors finished the week in positive territory. Capital was being reassigned, not withdrawn. Consistent with that reading, the portfolio recovered the bulk of the June 5th loss within two sessions and finished the month with a positive return and the second-widest monthly spread against the benchmark in 2026.
On the risk metrics: the YTD Sharpe and Sortino ratios reflect the full January–June period and show some June deterioration versus the May report.
The portfolio ran a more concentrated, directional book in the second quarter — EWY, TSM, SMH, and EMXC in size simultaneously — which is a genuine increase in thematic concentration risk relative to the more diversified January–February positioning. This will be addressed going forward.
GETTING THE ECONOMICS WRONG AND THE TRADE RIGHT
The macro call that framed Q2 deserves a “come to Jesus moment”, and my own research timeline provides the receipts.
Beginning in late March, Pinebrook’s published work made a high-conviction case for near-zero Q2 GDP growth, a prolonged Hormuz closure, and physical Brent crude reaching $150–200 per barrel by end-June.
The thesis was a 900-day inventory deficit, a $150 billion regressive energy tax on the US consumer, and a ceasefire that triage-solved the tail without reopening the Strait at meaningful scale. The call for zero GDP was explicit.
It was the wrong economic call. Q2 GDP came in at +2.7%. Brent is back near pre-conflict levels. The Strait ran longer than the one-month kinetic baseline assumed — roughly three and a half to four months of acute disruption — and growth smashed the zero forecast.
The July 4th economic update stated directly: the miss was “very wrong” on the GDP call and “very correct” on the view that the US would outperform its peers and that the AI capex cycle would hold long enough to bridge the wedge between shock and normalization.
The underestimate was in the offsetting forces — the restocking cycle, labor hoarding, and above all the AI capex cycle — relative to the mechanical GDP drag modeled from the supply shock.
The PNL, however, had a different experience from the macro forecast.
Q2 produced three consecutive positive months — April +4.02%, May +9.89%, June +1.77% — with no down months in the quarter. The reason is sequencing and the willingness to change the view when the evidence changed.
On the evening of April 7th, as markets absorbed the ceasefire announcement, Pinebrook pivoted and got long risk.
The repositioning that followed — into Korean semiconductors, Taiwan, broad semiconductors, and EM — was the book’s expression of a probability shift.
The worst-case scenario had been taken off the table, which concentrated forward probability toward the AI earnings cycle that equity markets were already pricing two years out.
The central thesis that ran through all of the published research — that the US would outperform the rest of the world through the shock, supported by reserve currency status, energy self-sufficiency, and the AI capex cycle as a structural floor — held throughout and remains the organizing framework for H2.
Getting the economics wrong and the trade right is a comfortable place to be because PNL > cute stories.
The discipline of updating when the evidence changes is part of the process, and Q2’s results are the outcome.
TRACK RECORD
Portfolio performance since inception in August 2024.
Lovely stuff, well done David
Really amazing how the flexibility allowed the portfolio to beat benchmarks despite making a high conviction call that went the wrong way. So much to learn from it!