


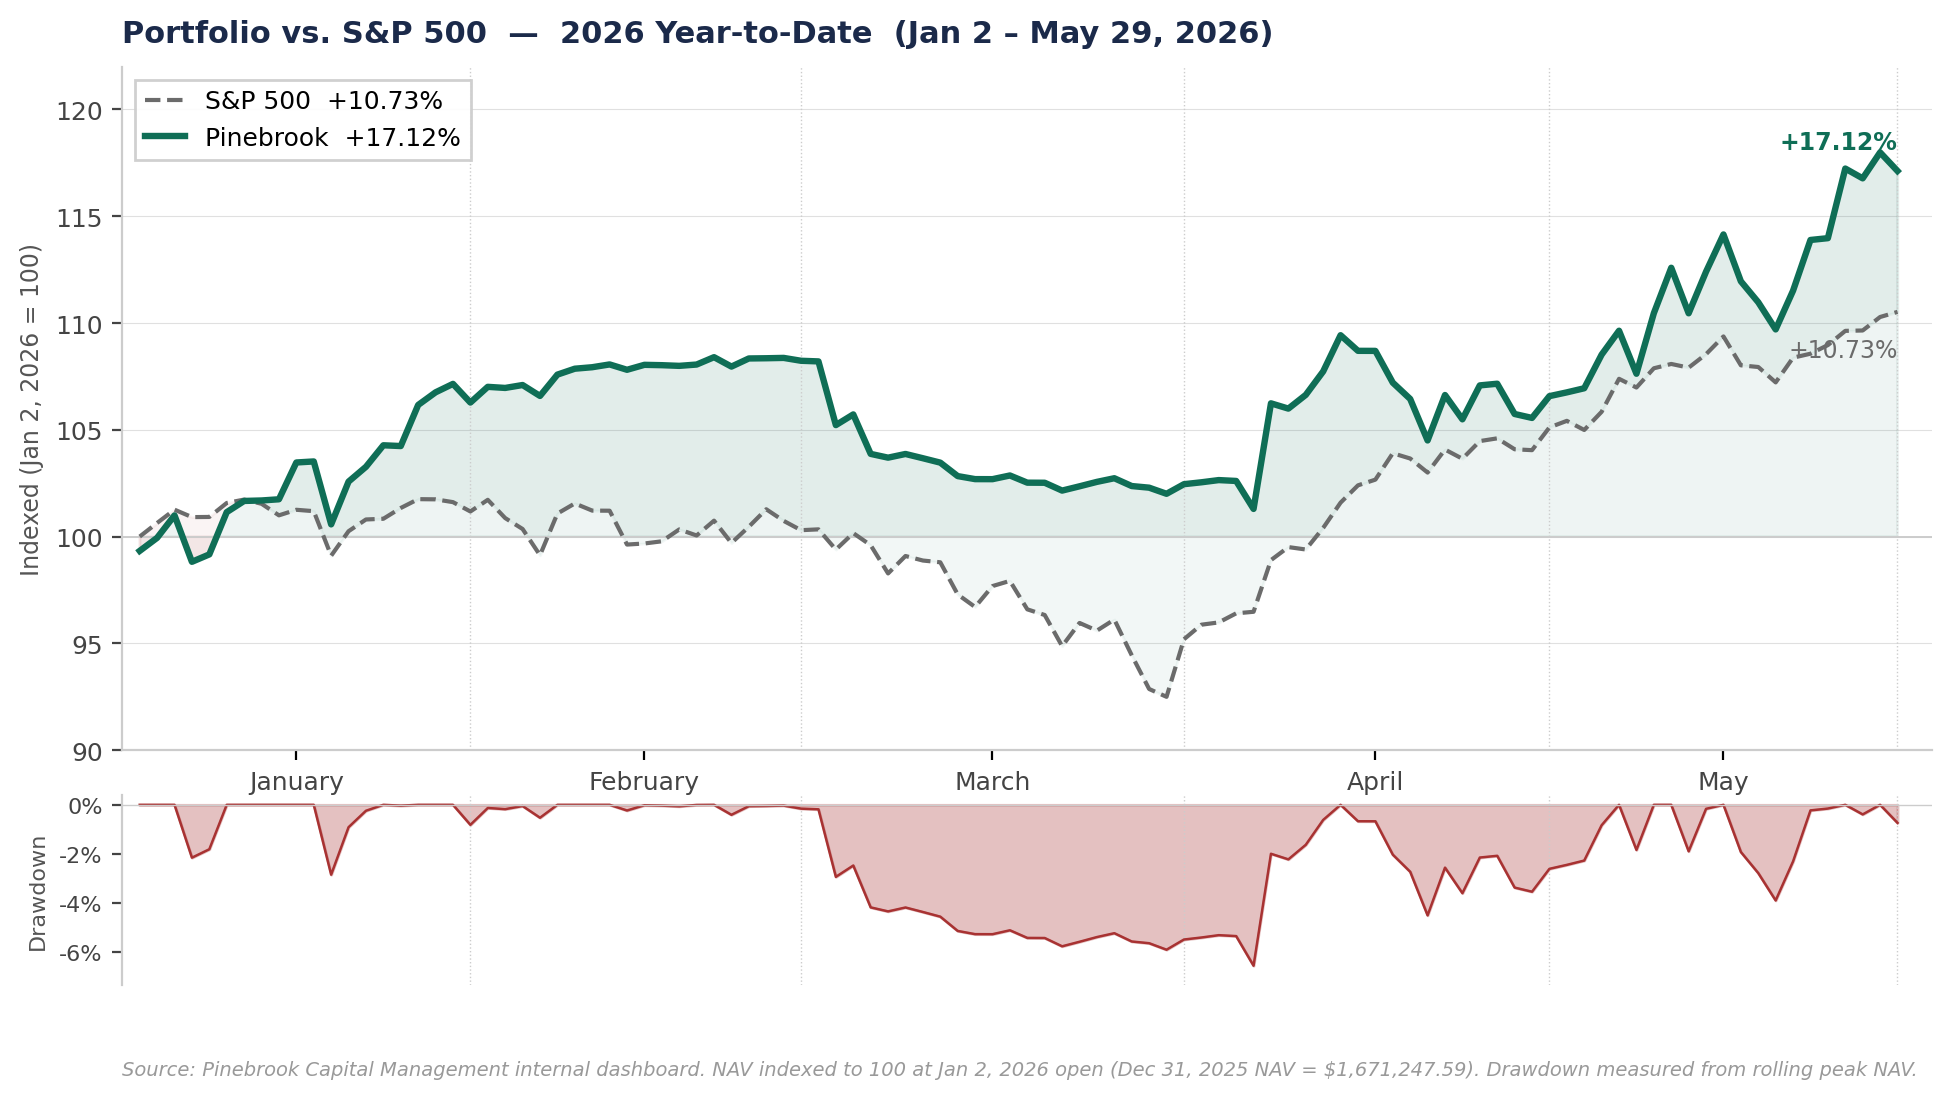
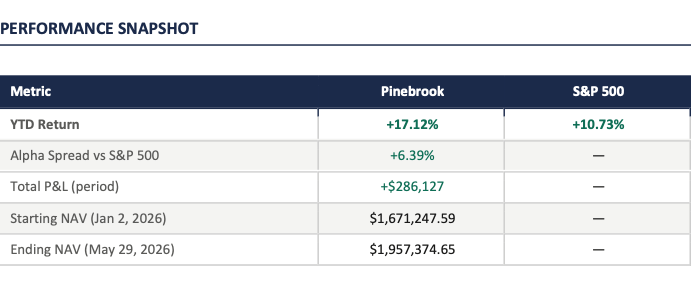
Pinebrook generated a +17.12% net return for the period January 2 through May 29, 2026, against an S&P 500 return of +10.73% over the same period — a spread of +6.39%.
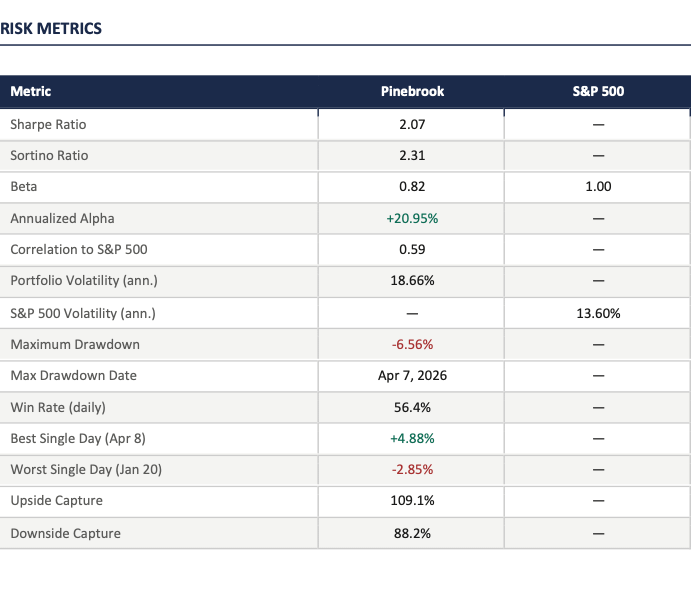
On a risk-adjusted basis, the portfolio produced a Sharpe Ratio of 2.07 and a Sortino Ratio of 2.31.
The Sortino exceeding the Sharpe — consistent with prior periods — confirms that realized volatility is skewed to the upside.
Maximum drawdown was contained at -6.56%, reached on April 7, 2026, during the war ceasefire, before recovering sharply.
Upside participation was strong at 109.1% capture, while downside exposure was meaningfully reduced at 88.2%capture. A beta of 0.82 and SPX correlation of 0.59 reflect a portfolio with market exposure calibrated to opportunity rather than passive index tracking.
The updated blotter and dashboard, through close of May 29, 2026, can be found here.


January – February: +6.28% / +1.84%
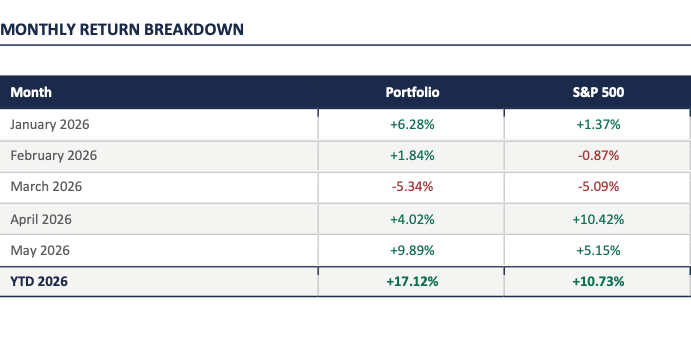
The portfolio opened the year decisively, posting gains of +6.28% in January and +1.84% in February against a flat-to-negative S&P 500. The primary driver in January was a concentrated position in Korean equities via EWY — entered in early January at $104.27 and closed January 30th at $123.96, a +18.9% return on the position. DXJ, capturing yen-weakening dynamics, contributed an 8.9% gain and was exited in mid-February. Silver short positions provided an additional non-correlated contribution in late January and early February. The combined effect was a +8.26% cumulative portfolio gain through the first two months against the S&P 500’s +0.48%, producing 778 basis points of spread.
March: -5.34%
March was the portfolio’s weakest month, with a decline of -5.34% against the S&P 500’s -5.09%, producing a modest negative spread of -25 basis points. A cluster of position unwinds — KRE, WNC, RSP, EWU, and DXJ — all moved against the book simultaneously during a period of broad risk-off positioning driven by war uncertainty.
April: +4.02%
April contained the period’s most significant single-event trading sequence. On April 7th the portfolio reached its maximum drawdown of -6.56%, driven by GDX/GDXJ long exposure and crude oil futures positioning ahead of the ceasefire announcement. The following session on April 8th produced the period’s best single day at +4.88%, as ES and NQ futures positions captured the market reversal. The April 9th–10th cluster — long-biased futures and long EEM — produced additional gains as global equities recovered sharply. Pinebrook’s April return of +4.02% reflects entry positioning that was partially caught in the initial drawdown before the recovery.
May: +9.89%
May was the strongest month of the 2026 year-to-date period at +9.89%, outperforming the S&P 500’s +5.15% by 474 basis points. Semiconductor exposure via SMH, reopened clean energy positions (QCLN, PBW), and broad emerging market participation through EMXC were the primary contributors. The closure of short Indonesia (EIDO) and short India (INDA) positions also contributed positively as those markets underperformed. Open positions at period close include meaningful long exposure to EWY, TSM, and ESM6 futures, along with a diversified book entered in the final week of May.

The following table places 2026 YTD performance within the portfolio’s full history since inception in August 2024.

great Job David and thank you for taking us along in your journey.
“On a risk-adjusted basis, the portfolio produced a Sharpe Ratio of 2.07 and a Sortino Ratio of 2.31.”......Perfect!