
U.S. Economic Growth Update
From the Asian Financial Crisis to the Strait of Hormuz: A Framework for American Resilience in an Age of a Supply Shock


Executive Summary
The Hormuz shock of 2026 is not 1997. But it rhymes. A major external disruption is sorting the global economy by structural architecture — and for the second time in thirty years, the United States holds the winning hand.
Reserve currency status, energy self-sufficiency, and an AI investment boom that mirrors the late-1990s technology cycle are together providing insulation that Japan, South Korea, and Europe simply do not possess.
The relative outcome is the same as 1997.
The absolute experience is harder — and the gap between what financial markets are pricing and what physical markets are saying is where the next trade lives.
Where We Left Off
The last issue of this series asked a foundational question: Is the Hormuz Shock a Productivity Regime Shifter? The answer was careful — not yet, but the clock is running.
As mentioned in the same note, the United States entered the Hormuz shock in possession of something historically rare and fragile: a pro-cyclical abundance regime defined by three simultaneous pillars — supply chain abundance, a mature and productive labor market, and a fixed investment boom anchored by AI hyperscaler capital expenditure.
That combination, last seen in the late 1990s, had produced the first sustained episode of non-recessionary productivity growth in a generation: lower inflation, supply chain normalization, and expanding margins without policy tightening.
Two forks in the road were laid out:
Path one: Temporary shock, productivity dips, supply chains normalize, abundance regime resumes.
Path two: Persistent supply instability drives firms from optimization toward resilience investment, raises structural costs, and shifts the economy toward something more European in its productivity and growth outlook.
The note was explicit that the 1970s stagflationary parallel was not the base case.
A hybrid regime of moderate inflation, weaker productivity, and volatile growth was the risk scenario that mattered.
Six weeks on, the physical data and the activity indicators have done meaningful work sorting between those two paths. The general architecture holds but several specific calibrations need to change.
Thus, this note integrates that evidence and expands the framework to include its international dimension — because the global distribution of this shock is as important as its domestic transmission, and understanding who loses more is essential to understanding why the United States still comes out ahead – and what the trade is.
The macroeconomic risk of 2026 is not a pullback in GDP or a one-off price shock. It is the growing risk to the post-pandemic abundance regime itself — and the uneven distribution of that risk across the global economy is the 1997 playbook on repeat.
I. The 1997 Blueprint: Architecture, Not Accident
To understand why the United States is structurally better positioned than its peers in the current Hormuz shock, one must begin not with today’s oil markets but with a currency peg in Bangkok in the summer of 1997.
The Asian Financial Crisis is often taught as a story about contagion. That framing is technically accurate but analytically insufficient. The real story is about architecture — the lethal combination of fixed exchange rates, which led to a balance of payment problem, unhedged foreign-currency debt, and the absence of institutional buffers that separate a manageable shock from an existential one.
Thailand’s baht came under speculative attack in July 1997. The peg broke. Dollar-denominated debt became immediately and catastrophically more expensive. Banks went insolvent. Credit froze. Contagion spread not because of shared economic fundamentals but because investors searched for the same currency mismatch architecture elsewhere and found it.
Indonesia contracted by 13 to 14 percent in 1998. Thailand fell roughly ten percent. South Korea, six to seven. World economic growth slowed from roughly four percent in 1997 to 2.5 percent in 1998.
And yet the United States kept growing — at 4.5 percent in 1998 — not by accident but by architecture. The exorbitant privilege, floating exchange rate, deep capital markets, and a domestic technology boom provided insulation that no other advanced economy possessed.
Capital fled crisis countries and flooded into dollar assets. Falling commodity prices from the Asian demand collapse functioned as a tax cut for American consumers. The Okun transmission barely fired.
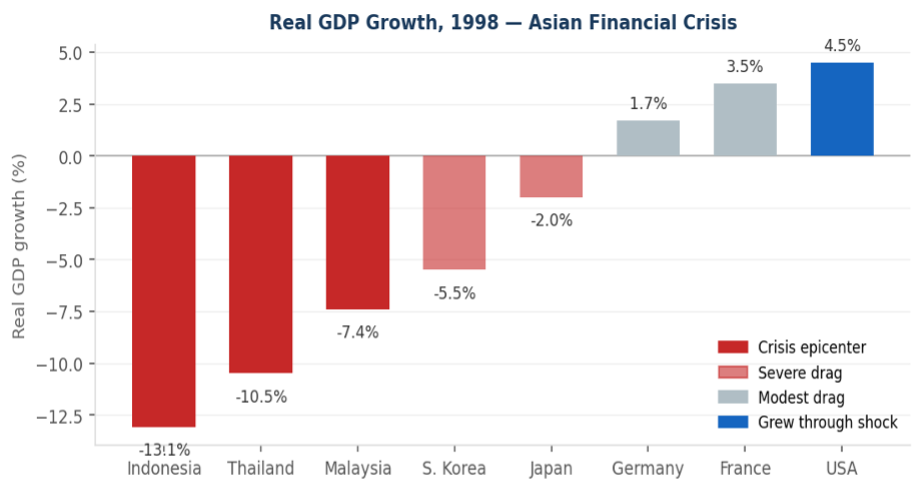
Figure 1. Real GDP growth, 1998. US grew 4.5% while crisis epicenters contracted 7–13%. Source: World Bank / IMF.
II. 2026: Same Architecture, Different Transmission
The Strait of Hormuz closed in late February 2026 following US and Israeli airstrikes on Iranian military targets. Tanker traffic through the strait has fallen approximately ninety percent since March 1st. Baker Hughes told investors it assumes the strait will not fully reopen until the second half of 2026. A Dallas Fed survey found nearly eighty percent of oil and gas executives share that view.
This timeline is consistent with what was written here, which diverged from the OECD’s more optimistic reopening assumptions — a disagreement that the physical data has since resolved.
That’s said, reserve currency architecture remains intact and actively functioning. Global capital, frightened by the scale of the energy disruption, continues to seek the safety of dollar-denominated assets.
Foreign portfolio inflows into US Treasuries, corporate debt, and equities were at their strongest levels in over twenty-five years as of January 2026, and the conflict has reinforced rather than reversed that dynamic. The narrative of a Sell America trade has no basis in the flow data.
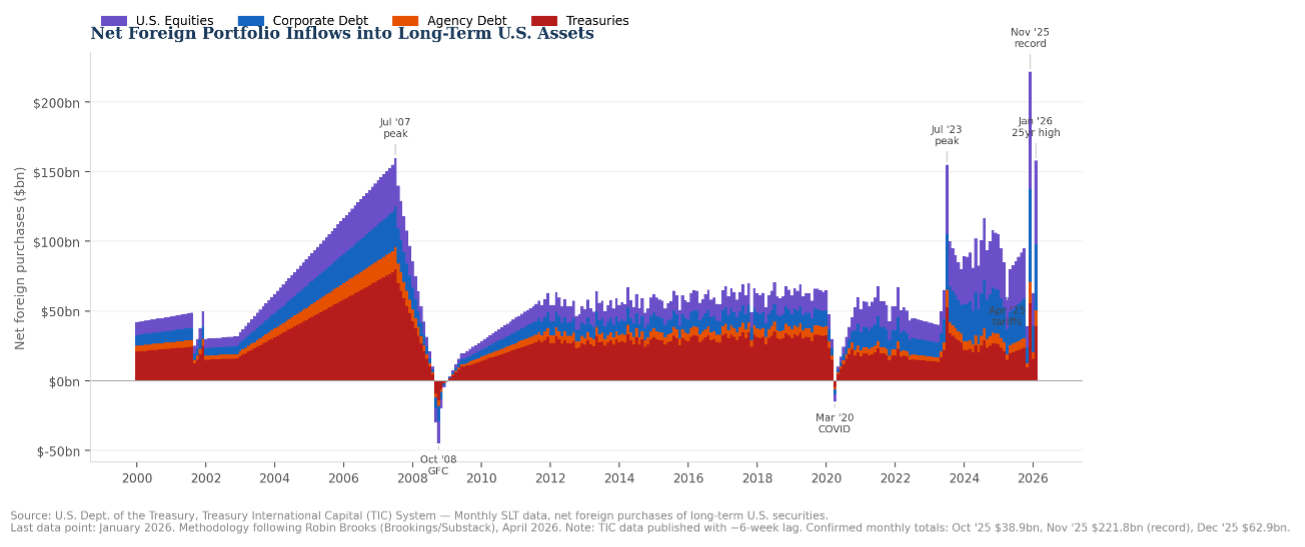
Figure 2.
One important precision note: the TIC data referenced runs through January 2026 because of the six-week publication lag. The statement holds but it’s worth knowing the January figure is the last available data point at the time of this writing, not a real-time reading.
Three differences from 1997 sharpen the analysis.
First, in 1997 the United States was a bystander; in 2026, it is an active belligerent bearing military and diplomatic costs.
Second, in 1997 the US consumer caught a tailwind from falling commodity prices; in 2026, the US consumer catches a headwind — an energy price spike that functions as a regressive tax.
Third, the dollar story is more complicated than 1997’s clean safe-haven appreciation.
US economic activity makes the domestic transmission visible in a single data contrast.
Nominal consumer activity registered 2.9 standard deviations above zero-percent real growth.
Real consumer activity registered 0.3 standard deviations.
That spread is the inflation tax made statistically legible.

Figure 3. Nominal vs. real consumer activity indices, Oct 2025 – Apr 2026 (est). The 2.6σ spread is the inflation tax: households spending more nominal dollars for less real consumption. Underlying Data Source: Employ America.
III. The Dollar: Exorbitant Privilege Meets Fed Politicization
The 1997 episode produced a textbook safe-haven dollar surge. In 2026, the initial phase of the Hormuz shock has produced a similar temporary pattern — risk aversion supporting the dollar as the conflict broke.
But the medium-term dollar trajectory looks materially different from 1997, and understanding why matters for portfolio construction and for interpreting the relative growth story.
The divergence comes from the Fed. Increasing political pressure on the Federal Reserve to ease policy ahead of midterm elections — pressure to cut rates even as core PCE runs above four percent — is the mechanism through which dollar weakness emerges not as a reserve currency crisis but as a conventional rate differential story.
When the Fed expectations and forwards guidance guide nominal yields below what the economic data would otherwise require, real rates fall relative to the rest of the world.
That is toxic for the dollar on a medium-term basis even if short-term risk aversion provides temporary support.
For this reason, Pinebrook maintains a short position in US duration, expressed by short ZN, the US 10-yr futures contract.
This creates an important distinction: reserve currency status and dollar direction are not the same thing. Reserve currency status — the structural demand for dollar-denominated assets, the exorbitant privilege — remains intact. Foreign portfolio inflows confirm it.
But the dollar can weaken on a trade-weighted basis while reserve currency status is perfectly fine. That is precisely what happened after the global financial crisis in the 2010 to 2013 period and is what the current rate differential structure implies for the year ahead.
Reserve currency status is a structural feature. Dollar direction is a cyclical one. In 1997, both pointed the same way. In 2026, they diverge — and that divergence is as important for portfolio construction as the growth story itself.
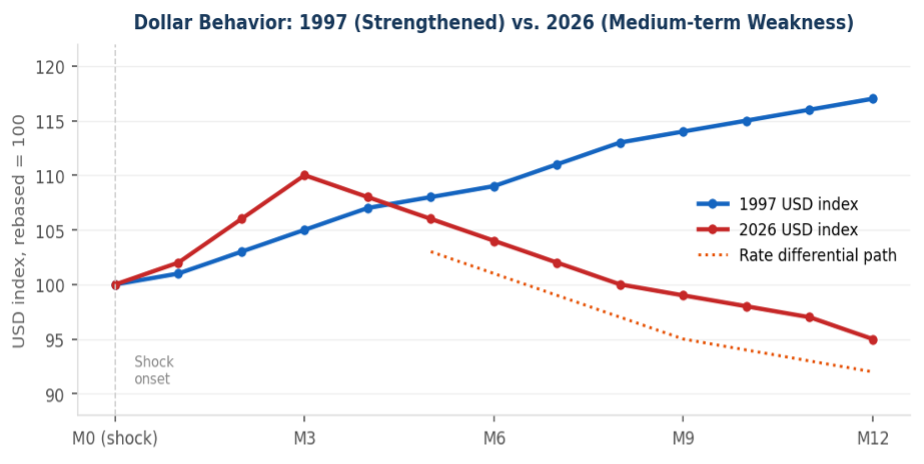
Figure 4. Illustrative USD index behavior: 1997 (continuous strengthening) vs. 2026 (safe-haven spike then gradual medium-term weakening driven by rate differential compression). Source: Pinebrook estimates.
USD price action below, since a negotiated settlement became the dominant strategic goal in US policy, reflects the above.
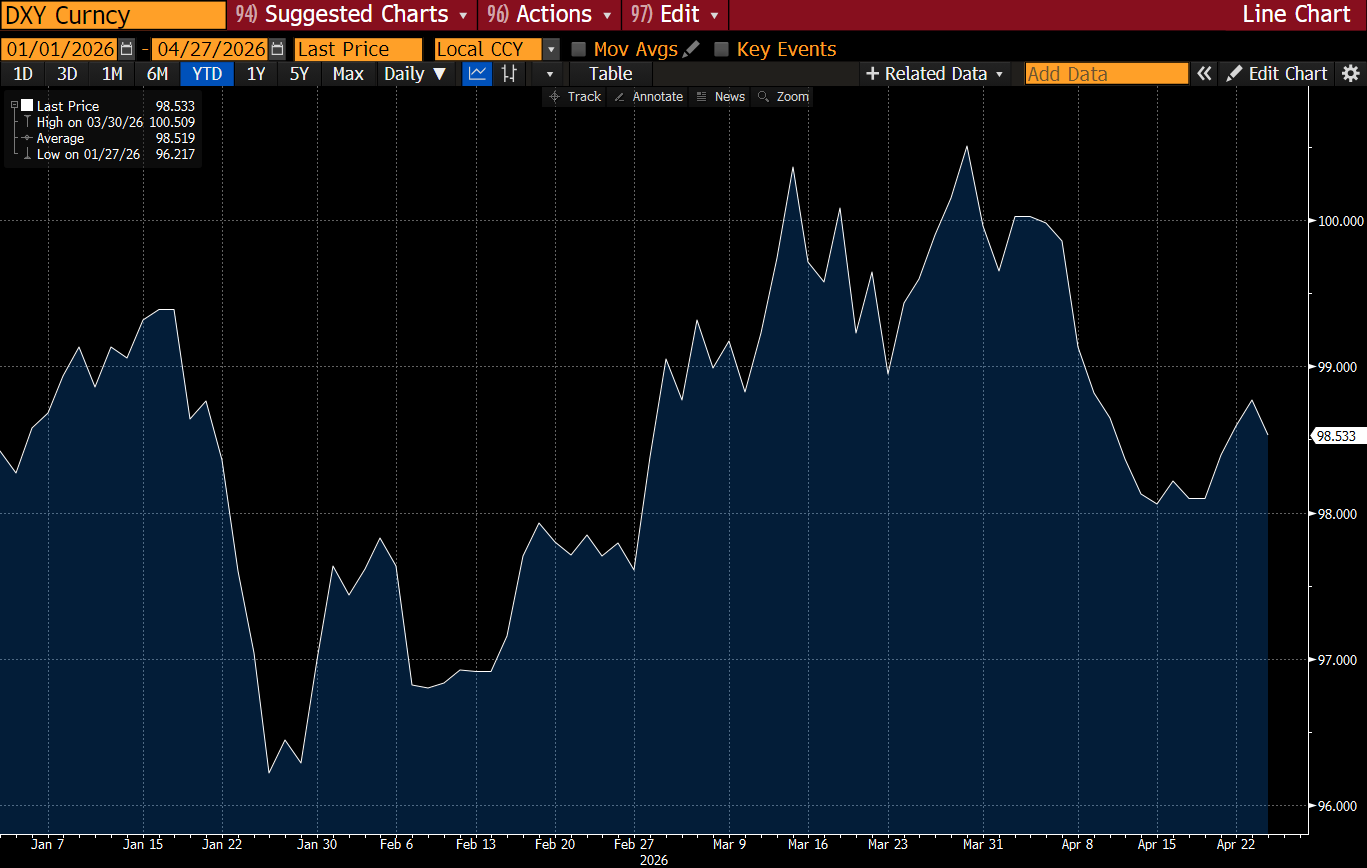
Figure 5. Dollar Currency Index. Source Bloomberg LP
IV. The Global Growth Map: Who Wins, Who Loses