

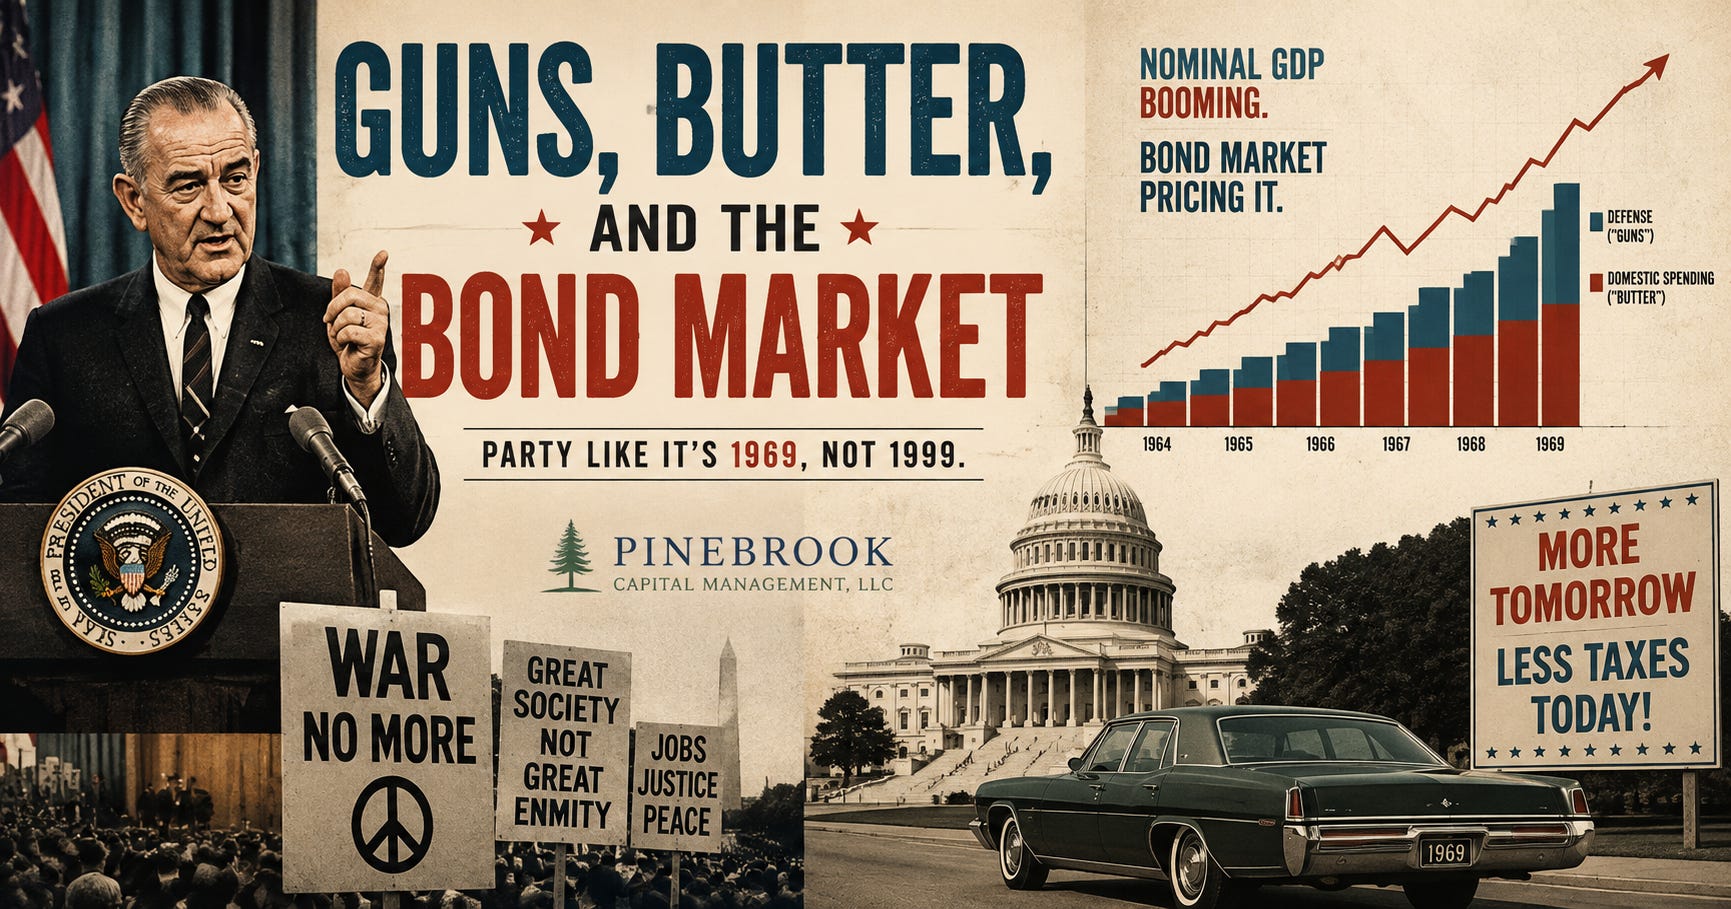
Last week’s note on August 20th established that the rise in long yields shifted on July 27, 2026, from a real-neutral-rate story to a term-premium story, concentrated almost entirely at the long end. That note answered the why of the movement.
Today’s note seeks to tackle a bigger question: what kind of world produces that move?
At the risk of giving it away, Pinebrook’s view is that the U.S. economy is currently undergoing an inflationary boom expansion.
While many market participants, too unborn to even remember disco and Studio 54, much less a man on the moon, have been conditioned by 40 years of disinflation and fifteen years of low-rate orthodoxy, the bond market is simply along for the ride and pricing the above.
Thus, the dog is wagging the tail and not the other way around as the so-called bond vigilantes would have you believe.
Party like its 1969, not 1999.
I. The Template: Guns and Butter, Twice
Wars are expensive. A government funding one typically faces a choice: raise taxes and cut domestic spending (guns OR butter) or run both simultaneously on the national credit card (guns AND butter).
President Johnson (“LBJ”) made the second choice, financing the Vietnam War while expanding the Great Society social safety net.
Fiscal and Inflation Scorecard, 1964 - 1969

The current and prior administrations have made the same structural choice, with one governing difference: LBJ’s butter went to the poor and working class; this cycle’s has gone to asset holders.
That distributional difference matters for who benefits (Lower-K wage earners vs. Upper-K owners of capital), but not for the causal mechanism that moves rates: booming nominal GDP (nGDP).
When the Current Clock Actually Starts
Using the current Iran conflict as a starting point for a LBJ Guns & Butter comparison era is lazy partisan thinking, as it undercounts how long the Guns & Butter agenda has been running.
A more appropriate baseline is January 2020. This is a five-year plus structural story.
The
war(butter) on Covid, marshalled the fiscal and monetary resources of the Federal Government and resulted in WWII-levels of fiscal spend and monetary accommodation.
o The CARES Act of 2020 under President Trump was a $2.2 trillion spending bill.
o The American Rescue Plan Act of 2021 under President Biden was a $1.9 trillion spending bill.
Tariffs are likewise on the guns side of the fiscal ledger: a national consumption tax, imposed on households and importers, that show up in the price data the same way a war bill shows up in the outlay data.
The OBBB reconciliation bill of 2025 under President Trump was more
lardbutter: upper-income tax cuts plus maintained domestic spending, financed on the credit card rather than through offsetting revenue cuts is identical to how LBJ financed the Great Society, just aimed at a different income cohort.
The IEEPA Tariffs Were Struck Down
On February 20, 2026, the Supreme Court ruled 6-3 that the tariffs imposed under the International Emergency Economic Powers Act exceeded presidential authority. Taxation power belongs to Congress, not the executive acting unilaterally under emergency powers.
The government had collected an estimated $130–175 billion under that regime and is now refunding it.
As of mid-August, roughly $100 billion (60%) has gone back out to importers.
The Whole Hog, 2020–2026

*10Y and CPI figures are calendar/fiscal-year-end approximations compiled from public trackers. Federal outlays are actual/reported FY totals; FY26 is a partial year (through July) and not directly comparable to the full-year columns beside it.
Highlights:
2020 → 2024: outlays rose from $6.55T to $6.75T, but the path wasn’t linear.
Spending peaked near $6.82T in the depths of pandemic relief (FY21), fell back to $6.27T as emergency programs lapsed (FY22), then climbed again through FY23–24 even as the emergency itself was long over.
The post-2020 baseline never returned to pre-COVID norms, regardless of who sat behind the Resolute Desk.
2025 → 2026 YTD (the current leg): outlays continue climbing from an already-elevated $7.01T base, now layered with tariffs, OBBB, and the Iran war.
The structural change that matters is not the spending itself, but its context:
An economy already near full employment with little to no labor market slack.
A wall of money hit an economy with supply chain distortions that were magnified by the sheer amount of cash that was put to work to bid prices up and clear tight markets.
What separates an inflationary boom from countercyclical stimulus is an overheating of the labor market instead of simply protecting it.
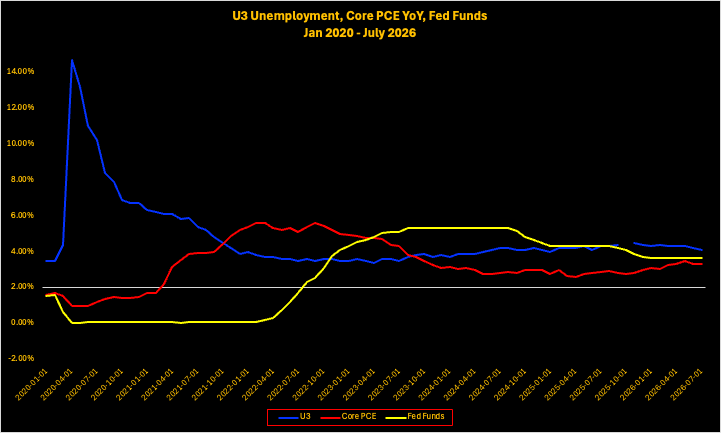
U3 moonshot from 3.5% in February 2020 to 14.7% in April 2020.
U3 ended the 2020 calendar year at 6.7%.
By calendar-end 2021, U3 was at 3.9% - back to full employment.
Monetary policy did not respond until Spring of 2022.
Fiscal restraint did not ensue despite the return to full employment.

The trajectory and outcome of the Iran War is the single biggest risk to this expansion remaining a clean inflationary boom rather than tipping into a stagflationary recession.
The reason is that the escalation could accelerate inflation faster than the tariff-and-tax-cut baseline alone would.
II. The Receipts
National debt crossed $40 trillion last week.
Excluding ~$8T in intragovernmental holdings, Treasury debt held by the public is now roughly 100% of nominal GDP.
Interest expense is approaching 1.0% of GDP, up from a 0.6–0.7% pre-pandemic norm sustained for roughly two decades.
The Reagan-era peak was 1.25%.
The 2026 YTD deficit already exceeds every full year between 2023 and 2025, inclusive.
Debt held by the public: $31.9T vs. $29.4T a year prior.
Notably, Petersen attributes the increase mainly to net interest (+$91B), Social Security (+$71B, COLA-driven), and Medicare (+$65B) — the entitlement-and-interest core of the budget, not tariffs or the war directly.
The counterweight: total nonfinancial debt-to-GDP (public plus private) has been broadly stable since 2010.
The rise in government leverage has been partly, not fully, offset by private-sector deleveraging.