
Market Commentary
Don't Believe The Cover Art

Despite having a day to go, the street is already getting its pencils out to discuss what happened in Q3. This would be the appropriate thing to do in ordinary times. We are not in ordinary times.
As of close Friday, September 26, 2025:
Since April 8th, the S&P500 (“SPX”) is up 33.33% in price terms.
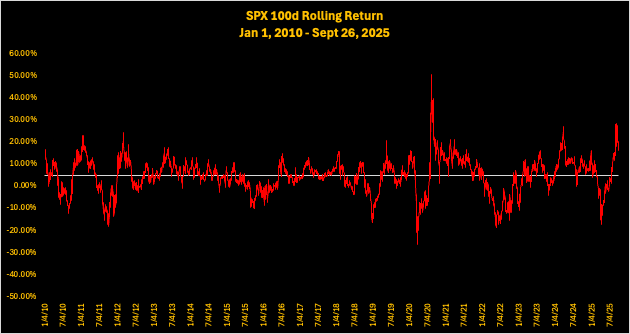
Since Jan 1, 2010, the rolling 100-day moving average of SPX price returns is 4.86%.
That is, on average, SPX delivers 4.86% price returns every 100-days, with a 9.59% standard deviation from the mean.
The 100d-MA for SPX peaked on September 2nd, at 28.75%, above the 2-sigma level of 24.04%.
The current 100d-MA is 17.58%, above the 1-sigma level of 14.45%.
Now averages don’t do anything to help us in understanding distributional sequencing. Rolling the dice based on averages usually bankrupts people.
Long time readers will recall we were promised single digit returns for 2025 because on average, third-year bull markets suck. So much for average, as SPX is now 12.96% YTD and QQQ is 16.58% YTD. Another 3-5% before year-end would be a run of the mill Santa Rally and would put these indices at the high teens and low 20s, respectively.
Coming out of Q2 and into Q3 this year, the consensus target of 6,600 on the S&P500 still looked reasonable, if not a tad optimistic. Now we are here 👇
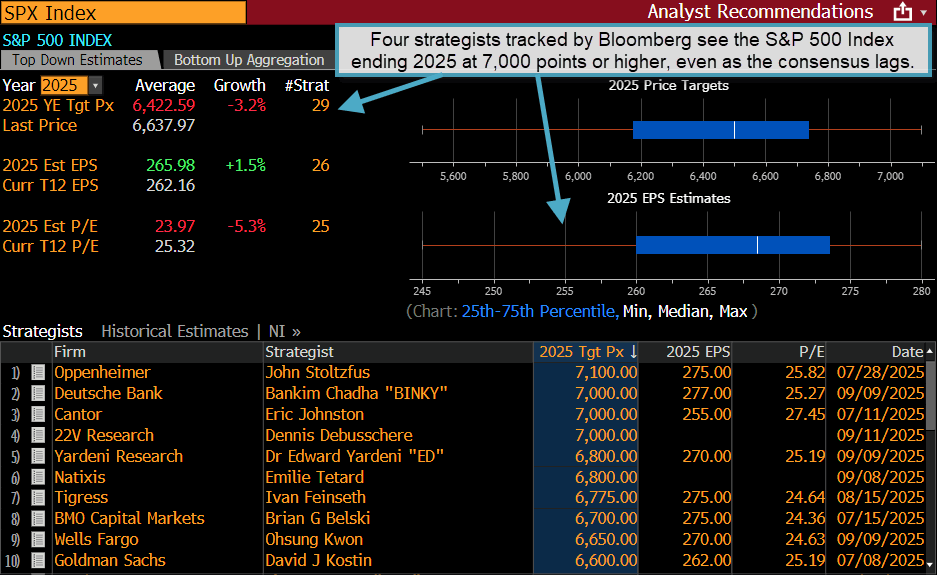
That said, mean reversion is a thing, and it happens by time and price. With everyone and their mother FINALLY acknowledging that we are in a bull market and U.S. recession risk is nil, it is helpful to look beneath the hood of price return data to understand investor sentiment.