
Market Commentary
A Tale of Two Markets

Footnote: The world has rapidly changed, and markets have repriced the new information surface. The below was written before this change, but it is still foundational for understanding how oil markets price physical and paper convergence.
An addendum at the end will provide an update.
Introduction
The prior note in this series laid out a framework for projecting Brent crude physical prices over the next three months, given the assumption of a prolonged closure of the Strait of Hormuz and an extended interruption in oil flows.
Since then, physical (“dated”) Brent has collapsed from the mid $120-levels on April 8th to a current $116-handle, after having tagged $144/bbl the day before.
This movement was also reflected in paper (futures) markets, after President Trump mentioned peace talks in Islamabad, which promptly dumped soon thereafter.
The targets laid out still stand given the assumptions. Kill the assumptions, kill the targets. Hold the assumptions, hold the targets.
Readers can make up their own minds about the expected length of the interruptions based on their political, diplomatic, military, or strategic priors. In the meantime, markets will ebb and flow to price the relevant new expectations given changes in the information surface.
With two weeks to go until the April 30th expiration of the June 2026 contract (COM6 <Commodity> GO on Bloomberg or BZM26 on the CME/ICE exchange), traders need to set aside such priors and focus on the upcoming reality of the June contract expiration: buy, sell, or roll the contract. There is no other option.
Shiny toy models are tired, skin in the trading game is wired.
Thus, this note is intended to frame the evolving structure of the crude oil market and to provide a probabilistic roadmap for the settlement of the June 2026 Brent futures contract.
The discussion integrates financial flow dynamics, physical market structure, arbitrage mechanisms, and refinery economics. The goal is not to predict a single price, but to define the range of outcomes and the conditions under which each outcome materializes.
Mind the Gap
As of April 16, 2026, the Brent market is exhibiting a quantamental fracture. The June 2026 (BZM26) paper contract is trading at $97.90, while physical dated Brent remains anchored at $116.74. This $18.84 gap is the battleground.
A conventional framework for pricing settlement price is simply the spread between physical and paper markets. Brent futures must converge to the physical market into expiry. This is not optional - it is enforced by arbitrage.
This isn’t wrong. But it is certainly incomplete and requires more nuance.
Futures do not converge to spot; they converge to the average physical price over the pricing window, which is itself influenced by various factors.
In effect, the June futures contract is a projection on physical tightness into June. More precisely,
Settlement ≈ ICE Brent Index ≈ f(Forward Brent, Dated Brent, CFD structure)
The appropriate way to approach the problem set is not by forecasting an oil price. We are solving for physical benchmark during pricing window, which requires mapping dated Brent (and forward Brent complex) into mid/late May → June.
What This Means Mechanically
Five elements are required to develop a projection for the June contract price at expiration.
The price of physical dated Brent. Brent futures are not abstract gambling instruments. They are tied to a physical settlement mechanism, which is linked to the ICE Brent Index.
Settlement is based on a basket of physical cargo pricing from the BFOET complex. BFOET stands for Brent, Forties, Oseberg, Ekofisk, Troll, plus West Texas Intermediate crude (WTI) from Midland, Texas, during the final trading days of the futures contract.
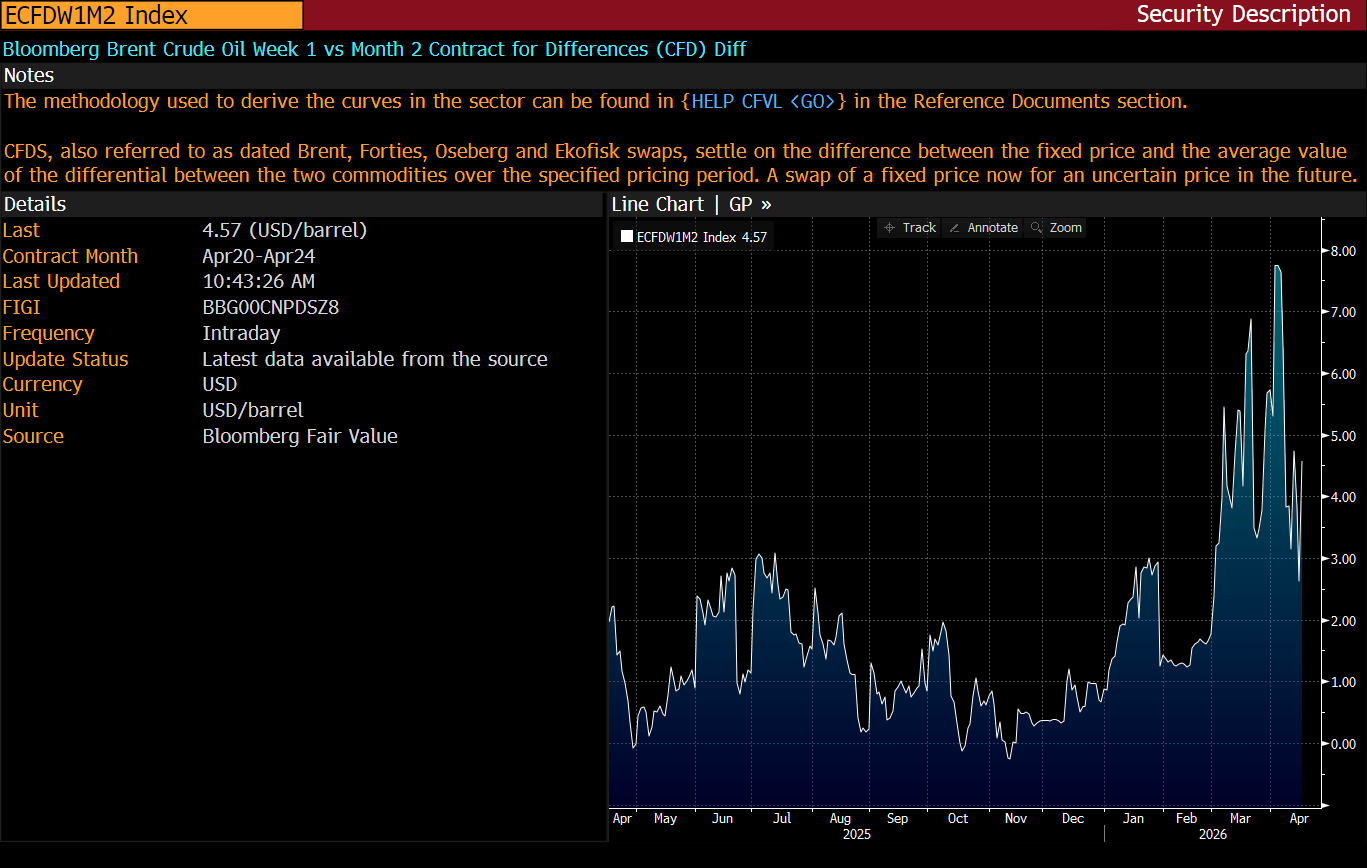
The CFD market (contracts for difference), which tracks the spread between physical dated brent today and the forward month. It is the physical bridge in markets.
In the North Sea market, the CFD swap allows traders to hedge the risk of physical oil prices changing between the time they buy a cargo of oil and the time it unloads.
The DFL market, (dated to frontline swap), which represents the basis risk between physical and paper oil markets. It is the financial bridge in markets which allows traders to lock in the difference between physical and paper markets should they move in opposite directions.
· If one has physical cargo priced off dated Brent, but hedged with Ice paper futures, one is exposed to the risk these two benchmarks move differently. A DFL cancels this risk.
Arbitrage and logistics, as the introduction of WTI in the settlement price of Brent introduces arbitrage. Logistics involves the carry associated with transportation costs (cargo leasing), cost of capital to fund an operation, insurance, and other costs that go with the physical movement of crude.
Refining Margins and crack spreads, which reflect refiner willingness to pay for crude.
Never Go Full Macro
The $97.90 price is a financial barrel of oil. It is driven by macro hedge funds and algos trading the Pakistan Truce headlines. These participants are shorting the front-month, betting that a 14-day ceasefire will reopen the Strait of Hormuz and collapse prices at some point T + timeT in the future. They are trading expectations, not molecules.
The initial move in paper crude oil—from sub-$100 levels toward the $110 - 120 range - was not driven by physical scarcity alone. It was, instead, a classic financial convexity event, consistent with the framework outlined by the Oxford Institute for Energy Studies.
The sequence unfolded in three stages:
Macro Hedging Demand: Geopolitical escalation triggered large-scale call option buying from macro funds and real money investors. Oil was treated as a hedge against inflation and geopolitical tail risk.
Dealer Gamma Feedback Loop: Dealers, short those calls, were forced to delta hedge by buying futures, creating a mechanical upward pressure on price. This is the point at which price becomes non-linear.
CTA / Momentum Amplification: Systematic strategies and momentum funds entered the market, further extending the move. However, these players are volatility-sensitive, and as realized volatility increased, their position sizes began to shrink.