
Weekly Signal & Noise Filter
Will They or Won’t They?

Pinebrook’s money shot from this summer (June CPI Preview on July 9, 2024) was to prepare for a more aggressive cutting cycle commencing in September, with either an initial 50-basis point cut or 100 basis points in cuts by calendar year-end.
Last week’s note ended with the statement that the Powell Fed would likely be forced to cut more than what is currently priced by markets.
It seems we have reached this fork in the road, with the probability of 50 now exceeding that of 25. This however is the noise, as markets have priced in these probabilities and the results are bound in price. The signal is in the Fed’s dot placement and forward view.
The U3 dot will reveal the Fed’s policy preferences for a tighter or more lose labor market, and it will be the key driver of the Fed’s forward view and subsequent reaction function.
The current inflationary state is one of continued disinflation, consistent with the soft-landing thesis. We have enough information from the August CPI and PPI releases to have continued confidence in this path, which resumed in late spring of this year after a seasonal inflation scare.
The state of the labor market is far more uncertain. July showed significant second order (deceleration) slowing in the labor market. The unrounded unwinding of this deterioration in the August report (from a 4.2553% U3 rate to 4.221%) widened the wedge between Fed rhetoric and market pricing.
Sahm Rule aside, there is now a consensus that the Fed is behind the curve.
Recall the 2-standard deviation spread between the 2-year Treasury note and the Fed Funds policy rate that was discussed last week.
With the unemployment rate currently 22-basis point above the Fed’s 4% year-end target, a year-end overshoot in the U3 rate is not a non-trivial possibility.
On the surface, the Fed’s job is to play catch-up, as Chair Powell made an explicit commitment at Jackson Hole to keeping the labor market anchored.
The labor market slowdown, however, cannot be seen in isolation and needs to be contextualized versus the broader macro reality.
Core PCE is on track for a lower print versus the June SEP projection.
GDP is on track for a higher print versus the June SEP projection.
The Fed’s catch-up commitment is further constrained by bureaucratic inertia that is informed by institutional memory.
Since 1990, the Fed has made three initial 25-basis point cuts at the initiation of a cutting cycle.
July 1995 => A mid cycle adjustment after raising rates by 300bps between 1994 and 1995.
September 1998 => LTCM.
July 2019 => The Powell pivot in January of 2019, after the market through a tantrum in December 2018, set the stage for a July 2019 cut.
Here is the list of 50-basis point cuts at the initiation of a rate cutting cycle.
January 2001 => It was clear as day the Fed had over played its hand with rate hikes in 2000 given the dot-com implosion.
September 2007 => This one is a no brainer given the housing market collapse and distress in financial markets prior to the GFC.
If the Fed is treating the initiation of this cutting cycle as a mid-cycle adjustment to a slowing economy, then history argues for a 25-basis point cut with a dovish forward guidance and dot placement.
The problem with this kind of sequencing is that 25 now plus more later, if need be, means that any future aggressive easing is an admission of distress and failure at not initially catching-up.
On the other hand, a 50-basis point cut at the September meeting is an admission that not cutting in July was a policy whiff.
If there is one thing Pinebrook has learned in over 30-years of studying markets, it is that policy makers do not like to admit to being wrong.
Thus, the dilemma for the Powell Fed is to catch-up without admitting they were ever behind in the first place.
This contradiction is the equivalent of admitting an affair to a spouse while professing emotional loyalty. It is hard thing to do. But not impossible.
In economic terms, the Fed is either betting that the weakening of the labor market is part of the continuedadjustment process of post-pandemic normalization (25), or, that the normalization process is complete and additional weakening needs to be arrested by more aggressive action (50).
There are two data points that inform Pinebrook’s view of a labor market that is still normalizing.
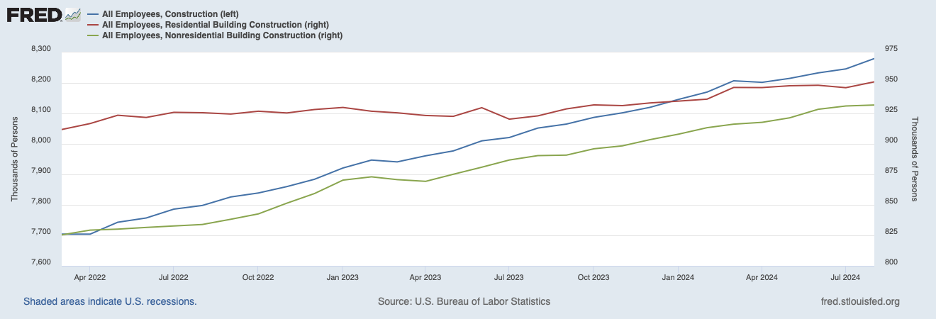
One of the most leading indicators of the labor market, construction employment, continues to grow.
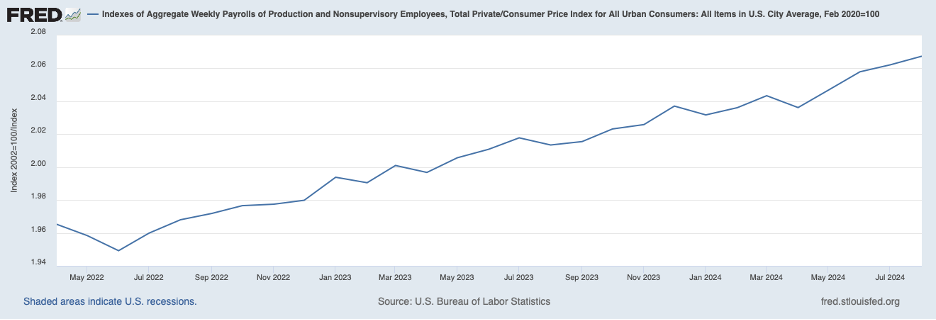
Real aggregate non-supervisory payrolls continue to grow.
Big picture, aggregate construction employment continues to grow. With 7 out of 11 post-war recessions originating in the housing market, the odds of recessionary distress in the labor market over the quarter remain low.
Construction and manufacturing are part of the goods-producing part of the economy, which continues to grow.
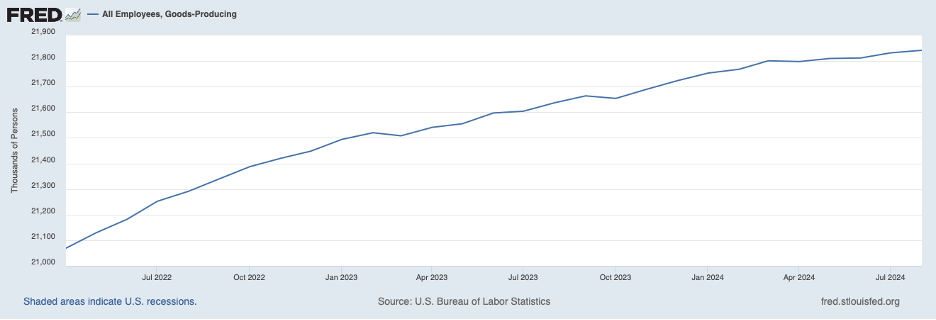
This is important to know as services employment almost never turns down except late in deep recessions. If goods producing jobs continue to grow, recessionary labor market conditions are likely not around the corner.
Rising real (inflation adjusted) aggregate payrolls for non-supervisory employees (aka, “Joe six pack’) continue to rise. This is leading because employers typically cut hours before cutting employees. If the aggregate number continues to rise, it likely that employers have not reached the cutting hours phases of a labor market slowdown.
While it is true that labor market recessionary impulses start with an initial lack of hiring, it is also true that the U.S. economy has never experienced a recession with rising real earnings for the broadest segment of the labor force.
The current U3 dot path suggests that the Fed is in the labor market normalization mindset.
4.2% is their projected peak in the unemployment rate in 2025, with a decline to follow in 2026. Thus, the FOMC will likely treat the current U3 rate as something within their tolerance threshold.
This Fed has shown time and time again this year that they are willing to drag their feet out of an overabundance of caution.
This Fed dragged its feet on getting in front of inflation when it was accelerating in 2021 and will likely drag its feet in this half of the cycle.
As with most decisions in life, this Fed will drag its feet on the tough call and have its come to Jesus moment with more aggressive rate cuts after the September FOMC meeting.
A dovish 25-basis point cut is therefore the model outcome for Pinebrook.
The implication of a dovish 25-basis point cut is that the forward guidance will likely become more forceful in support of the labor market.
Concluding Remarks
The labor market is the standout in a broader macroeconomic picture that is out of line with a 50-basis point cut.
Bureaucratic inertia and institutional memory do not support a 50-basis point cut.
Construction employment growth and real aggregate payroll growth suggest the labor market is still normalizing.
The current labor market slowdown is still within range of the Fed’s projections from the June SEP.
This Fed is a foot dragger.
The volatility surface will be determined by the forward guidance, not the size of the current cut.
Hi! Pls accept my follow request. Handle @Disident7
Thank you
IDK. Permits declining should mean new construction will fall a lot in the coming quarters. Better be safe than sorry.