
U.S. Economic Growth Update
Trumping, not Trumped

Despite the constant barrage of headlines surrounding President Trump's administration, the U.S. economy continues to show remarkable resilience and continues to outperform expectations.
NFP came in at 143K (below expectations but roughly still at replacement /break-even rates).
U3 ticked down to 4%.
November and December of last year had a combined positive 100K job revision.
This is the noise everyone has already heard. Additional noise is found in the annual revisions to both the Establishment Survey (“NFP”) and the Household Survey, which informs the unemployment rate.
First, recall a U.S. Economic growth update, published on June 20, 2024, where a discrepancy between booming NFP prints and an increasing U3 rate was observed. This observation allowed for the fading of the Sahm Rule growth scare last summer. Dips were bought. Money was made.
“Despite the economy rebounding in 2023 and into 2024, the labor market has continued to cool as measured by the unemployment rate.
Pinebrook’s view is this is due to the sudden and disproportionate jump in the size of the prime age labor force.
In other words, the number of unemployed, and the unemployment rate, have continued to grow despite growth in the overall economy.
To be clear, these data sets are noisy. But if we go with the idea that the Household Survey has been under counting prime working age population growth, it will solve for the divergence between booming NFP prints and a rising U3 rate”.
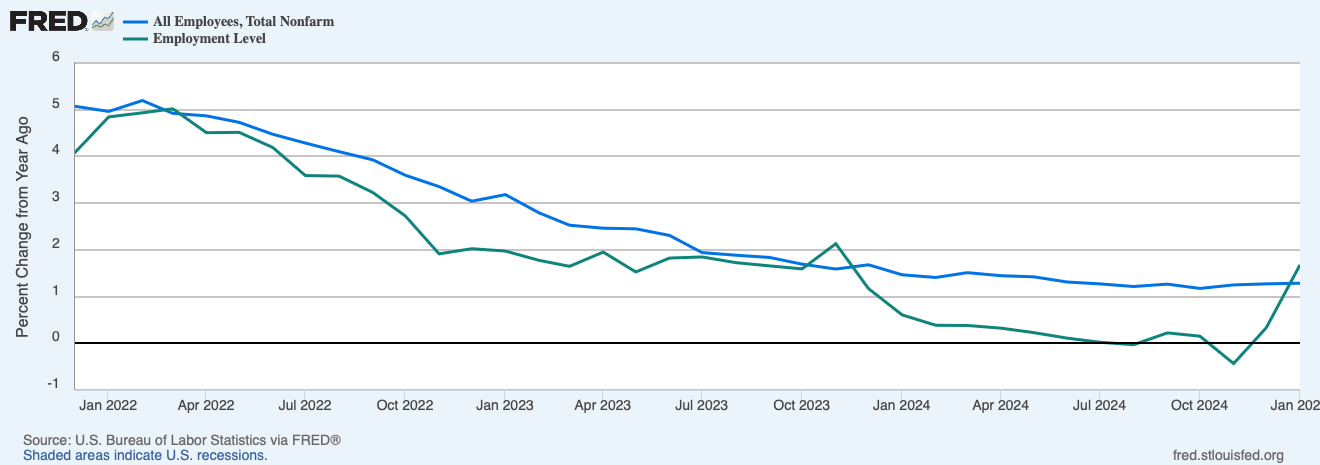
The aforementioned annual revisions have validated the conjecture of summer 2024.
The QCEW indicates that NFP have over-counted around 600K jobs.
The Household Survey under-counted 2.2 million jobs.
The downward revisions in the Employment Survey, and the upward revision in the Household Survey, have converged the two time-series.
So what? This is backwards looking stuff, you, dear reader, might be tempted to say.
The so what is this: Similar to the illusory discrepancy between NFP and U3 last summer, which was a backward-looking fade, so too is the convergence in the time series depicted on the chart above.
Meaning, the labor market appears strong, but the compositional structure of future job growth is sus. Weakness in cyclical sectors are a likely catalyst for a May cut by the Fed.
No need to belabor issues with manufacturing employment, which went from slowing growth to outright decline in October 2023, other than to point out that the YoY rate of growth is at its worse since the pandemic recovery.
Traditionally, this has been a big red flag. And while the economy has evolved to the point where manufacturing is a smaller part of the economy, current employment growth rates in this sector are consistent with pre-recessionary conditions, even as recent as the GFC.
Skipping visually polluting charts due to their lower relevance.
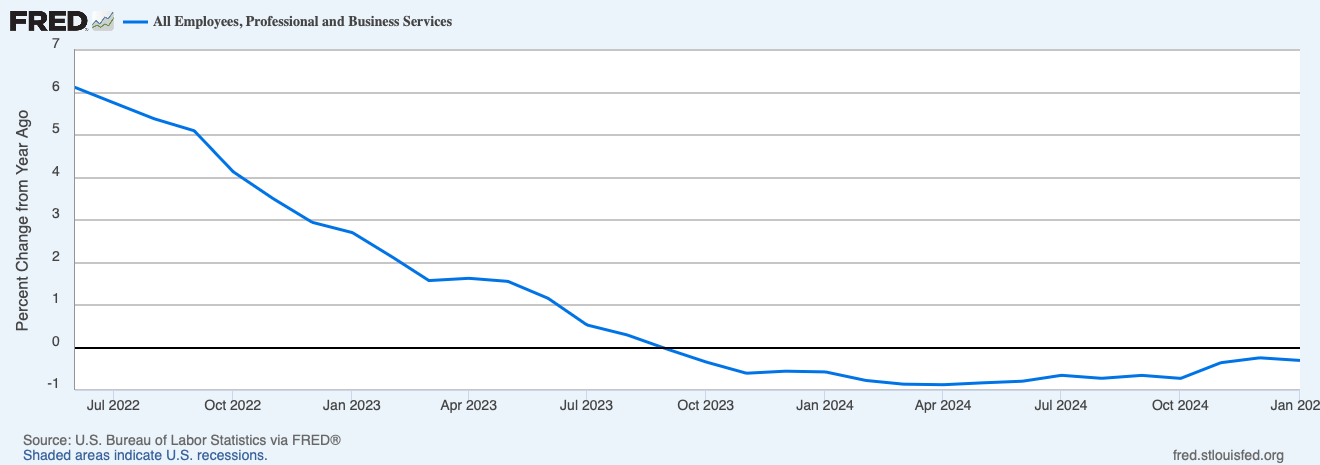
The bigger employment problem lies in professional and business services employment.
More than half of the negative 600K NFP revisions mentioned earlier are due to declines in Professional and Business Services. These are typically well-paying jobs, and this time series is now negative .3% on a YoY basis and shows around 15-months of outright losses.
Unlike manufacturing, professional and business services are a secularly growing part of the labor force and cannot be hand-waived away as irrelevant.
Furthermore, this may or may not be an AI phenom.
The remainder of the services sector continues to boom, particularly food services, drinking places, and healthscare.
[Publisher’s Note: healthscare is not typo, but an ironic pun on the American healthcare delivery system].
Total construction job gains have completely offset manufacturing job losses.
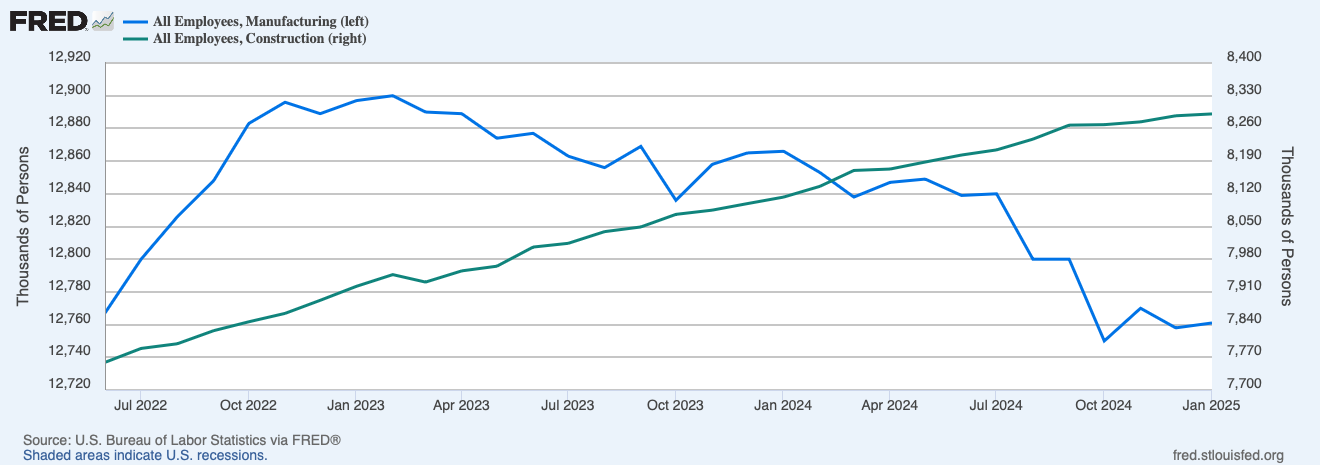
The lynchpin of the labor market, residential construction, hit a new all-time high. The risk is, how sustainable is this with unit construction now 15% below its post pandemic peak?
Proposed tariffs on imported construction materials are not helpful here, even if simply political noise.
Residential construction employment has already gotten long in the tooth. Unit construction was basically flat for around 18-months after summer 2022 peak and is now down 15%.
The closest analog would be the late 1980s, when unit construction turned down in late 1986. Residential construction employment increased for 22 more months after actual construction had inflected lower.
Acyclical sectors like education, healthcare, and government, which is where the majority of job growth is, are vulnerable to federal spending cuts (DOGE?).
To be clear, none of the above should be construed as a doomer narrative. However, a labor market with multiple cyclical sectors, showing additional deterioration at the same time, will likely be the catalyst to be flagged for a Fed cut in May.
Of course, the above does not happen in an inflationary vacuum. Previous notes have flagged hot Q1 seasonals, with January being particularly so. A lot of these seasonal pressures were pandemic distortion hangovers, which fueled a “new year, new prices” phenom.
While most of these shocks have subsided, tariff risks are raising the risk of a continuation of the above. Even if tariff threats are waived away, their announcements create risk business risks for supply chain management that need to be hedged in one way or the other.
In addition, the Fed has less room to see through tariff-related price increases, as transitory is now a career, legacy, and electorally ending four letter word.
Even with shelter delivering relief to inflation overshoot pressures, heatmaps continue to reveal price pressures in financial services, airfares, automative repairs and insurance.
Food continues to be stressed (eggs?). While not a part of core inflation, there is some pass through with food prices into core services. After all, restaurants have a limited ability to eat the price increases of their core inputs. Customers, however, are less constrained.
Pinebrook’s core CPI and core PCE projections are both .3% MoM.
Concluding Remarks
The U.S. economy remains strongly in expansion mode and in mid-cycle state.
The labor market remains strong but is being held together by growth in acyclical sectors while most cyclical sectors (minus construction) are experiencing deterioration.
If acyclical sectors give-way, or cyclical sectors worsen, a broader, general deterioration in the labor market becomes a real risk.
The Fed will likely front run these risks but will first have to navigate near term inflationary upside risks from a seasonably hot Q1.
Fantastic post—presenting the facts with unfiltered clarity. Thank you for this. I have two questions, if you don’t mind, regarding labor deterioration symptoms and potential near-term inflationary risks:
Labor Market: The Atlanta Fed’s Wage Growth Tracker’s three-month moving average has been in a steady downtrend since beginning of 2023 except for minor bumps here or there like for example - last hourly earnings data. How much weight do you assign to this data, and wouldn’t this further support the broader labor market deterioration you’re highlighting?
Inflationary Risks: Looking at historical precedent, when the U.S.-China trade war escalated in 2018 and with the first implementation of Trump tariffs, interest rates actually declined steadily until the onset of COVID. Despite initial fears, tariffs didn’t drive inflation as much as expected. Could we see a similar dynamic play out this time?