
U.S. Economic Growth Update
Getting Soft but not Wobbly

The housing market-centric economic slowdown that Pinebrook projected in the last U.S. Economic Growth Update (April 29, 2024) has become a consensus understanding.
The 10-year treasury note is down roughly 40 basis points.
The U3 unemployment rate continues to tick up and is currently at 4%, after starting the 2024 calendar year at 3.7%.
Inflation has resumed its disinflationary trend after experiencing seasonal distortions during the first quarter of the year.
Today’s housing permit and housing start data have confirmed the softening economic projection that would originate in the housing market, with these metrics at their lowest levels since 2020.
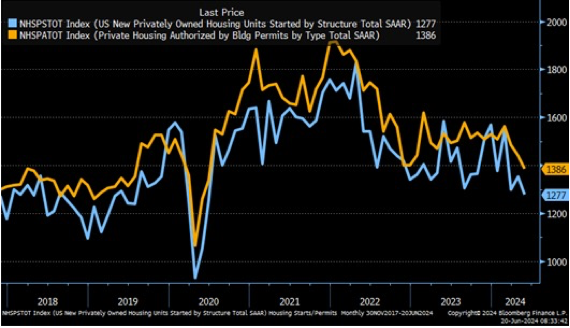
The cyclical risk with the housing permit and start data is that unit construction and housing construction employment will continue to trend down, more so now that pandemic related construction backlogs are mostly done with.
In addition to the above, Pinebrook’s favorite forward-looking employment gauge, real retail sales, continues to slowdown.
May came in at .1% in real and nominal terms.
April was revised down by -.2%.
On a year-over-year basis they are down -.95%.
We now have four out of five of this years’ releases registering negative YoY growth rates.
Historically, consumption leads employment, and the real retail sales trends point toward softer monthly employment data over the summer months.
The above is consistent with the soft-landing framework we have adhered to since November of last year. Markets, however, will likely overact to the data as the Sahm Rule comes into focus.

Currently at .37, the indicator has spent most of the calendar year inching up to the .5 recessionary threshold. Originally conceived as a motivator for fiscal transfer payments, the indicator would provide the green light to the Fed to initiate a round of policy rate cuts in an attempt to front run and stave off recessionary conditions in the labor market as part of its dual mandate.
A 4.2% U3 rate by July or August would do the trick and generate a .5 Sahm Rule red alert.
Whether or not these levels manifest themselves is to be determined. What matters is what markets anticipate and price in.
Advancing past the .4 level would be the proverbial yellow flag that puts policy makers on notice.
Even if there is no change in the U3 rate at the next release date and U3 remains at 4%, the .4 yellow flag threshold will be broken.
Short of any declines in the U3 rate, breaking .4 is a mathematical certainty at this point.
This is a fade in Pinebrook’s view.
By August base effects will kick in and mid 3-handle, 3-month moving average rates will roll off the lookback window and should mark the Sahm peak for the calendar year, assuming no sudden U3 rate moonshot.
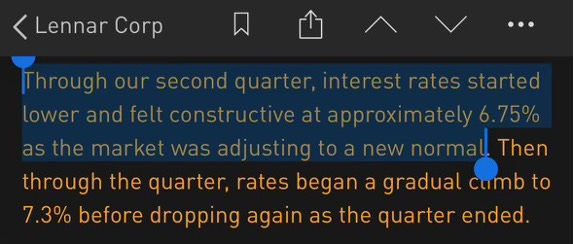
Echoes of the late spring fall in rates will manifest themselves in more housing activity. A 6.75% 30-year mortgage rate is the sweet spot for housing bullishness, according to Lennar.
Unless interest rates increase further, permits and starts will stabilize, and eventually so will units under construction, which is expected to happen in late Q3.
Disinflation trends will continue to get priced in and result in more easing in financial conditions.
Looking beyond Sahm, there are labor market distortions and measurements that need to be considered (wonk alert!) to contextualize the slowdown in the broader economy.
As with many other indicators, the pandemic has distorted our understanding of population growth, specifically as it comes from immigration.
The Census Bureau and the Congressional Budget Office have divergent views on population growth.
Since March 2022, the CBO estimates show an additional 1% growth in population, or roughly 3.36 million vs. the Census Bureau.
Assume most of this immigration was primarily from Latin America, for whom the employment to population ratio is roughly 64% for Latinos vs. 60% for the native-born population.
This results in an addition 2 million new entrants into the labor market.


The U.S. economy began to cool in mid 2022, with two back-to-back quarters of zero or less real GDP growth. The labor market lagged and continued to tighten into January 2023, when the U3 rate bottomed at 3.4% that month.
Despite the economy rebounding in 2023 and into 2024, the labor market has continued to cool as measured by the unemployment rate.
Pinebrook’s view is this is due of the sudden and disproportionate jump in the size of the prime age labor force.
In other words, the number of unemployed, and the unemployment rate, have continued to grow despite growth in the overall economy.
To be clear, these data sets are noisy. But if we go with the idea that the Household Survey has been under counting prime working age population growth, it will solve for the divergence between booming NFP prints and a rising U3 rate.
The point of this thought exercise is not to get hung up on exact details, but to reconcile opposing truths to contextualize what is going on in the economy.
Taken a step further, the implication is that fears of an imminent recessionary labor market meltdown should be faded given the demographic realities of the U.S. labor force.
Concluding Remarks
The projected slowdown has arrived, as confirmed by housing market data.
A U3/Sahm-rule growth scare over the summer is a high probability event at this point.
The growth scare should be faded.
Pinebrook prefers rates over risk assets into the summer and will look to flip and back up the truck on risk assets on pullbacks if the growth scare materializes.
can you update us on how you are implementing the rates trade?
Good stuff.