
The State of the Macro
Looking Past the Current Slowdown

There was little new marginal information over the past week during the shortened Thanksgiving holiday.
This all changed on November 28th.
It is now common knowledge that the U.S. economy is slowing. The question for investors is, at what rate and over what time frame?
Time series state-level analysis of the de-growth impulse can provide us with clues to the above.
At the state level, more than half of U.S. states are showing recessionary signs based on coincident indicators published by the Philadelphia Fed.
The Philly Fed’s state diffusion indexes show less states improving in October, and more states worsening, relative to September.
For example, the number of states showing growth went from 30 to 16 in October, and the number of states showing de-growth went from 17 to 27 in the same time frame.
Smoothed 3-month data shows a less dramatic, though similar dynamic of less states growing and more states contracting.


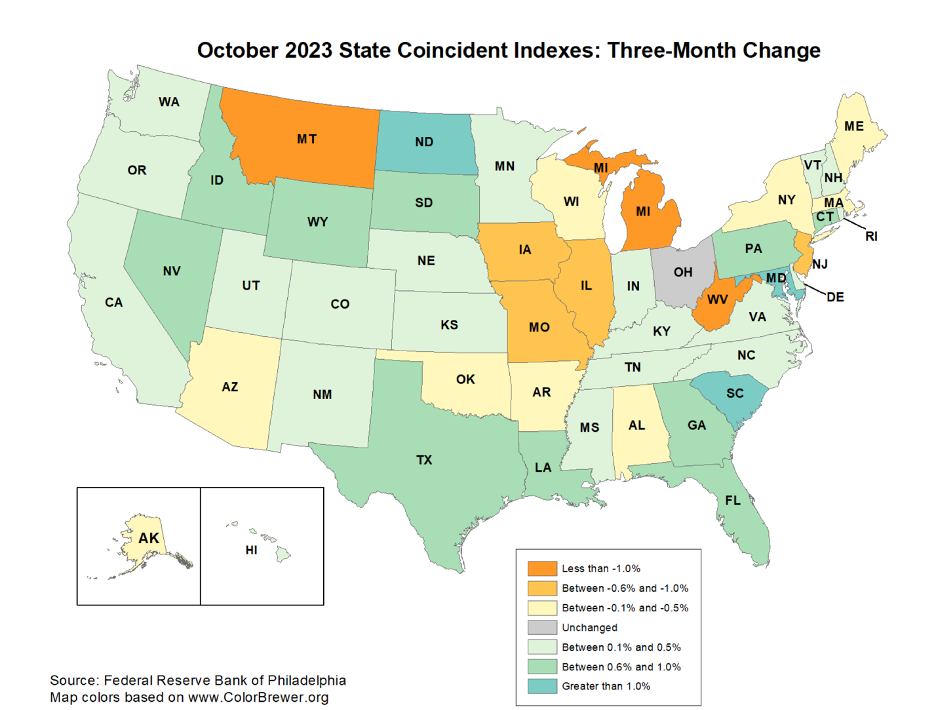
Despite the spreading of de-growth, the large-state drivers of the U.S. economy, such as CA, FL, TX, PA, GA, are still experiencing expansive growth.
The large growth states will likely generate enough national output to keep the broader economy in a positive growth trajectory for the remainder of the calendar year and into Q1 2024.
Financial markets have seized on de-growth and on a continuation of the disinflationary impulse. Since the nominal rate high on October 25th:
Nominal rates are down 68 bps (Nov. 28th).
Real rates are down 40 bps (Nov 28th).
10yr break-evens are down 25bps (Nov. 27th).
Risk premiums are down 49 basis points (Nov. 27th).
In the U.S. growth update, published on November 19th, the odds of a rate cut in H1 2024 were 82.25%.

Those odds today are 89.5%

We get a similar information surface confirmation from the equity market.
Over the last 5 years (1,260 trading days), the VIX has only closed at or lower than last Friday’s levels on 25 trading days (2%).
A VIX of 12 is one standard deviation below its long run average of 20, and it rarely trades less than 1-sigma.
While the VIX is a noisy co-incident indicator that can flip on a dime, the signal is in its confirmation of the rates complex: the growth and inflation matrix is reflective of the non-recessionary soft landing.
Update: On November 28th, Fed Governor Waller opened the door to a cut in policy rates based on disinflationary pressures with the intent of avoiding a restrictive policy stance.
This aligns with the last conclusionary remark made in the November 19th U.S. Economic Growth update:
“The Fed reaction function will likely shift from inflation fighting (“hawkish”) to supporting a sustainable expansion in the context of a continued disinflationary impulse (“dovish”).”
Loosening financial conditions will now put a floor to the current decline in growth, particularly in the housing market, and the resolution of the UAW strike will be supportive of manufacturing activity.
Within housing, lower mortgage rates driven by a decline in yields, as well as mortgage spread compression resulting from a decline in rate volatility, will be stimulative to the sector.
Forward betting markets are telling us it is increasingly likely that the slowdown process will reverse itself in the next 2-3 months.
Keep It Real Part I