On August 3rd I looked at what history says about SMH after a ‑20% correction. SMH had just crossed ‑20% (July 28th) and bottomed at ‑24.6% the next day.
The conclusion was that the base rate argued for skepticism that the July 29th low would hold.
Since then SMH rallied 25.7%, to within 5.2% of its June 22nd high on October 5th, then gave almost all of it back in the AI credit scare covered in yesterday’s note. It fell 10.5% last week, its fifth-worst week since 2011, on nine straight down days, the longest losing streak in its history. Friday’s close was $539.79, ‑19.3% from peak.
Bottom line up front:
History still says lower. Every completed ‑20% episode made its final low later and lower than the crossing. The two that rallied back to ‑5% (2015-16 and 2024-25) went on to new lows.
Credit is the tell. Every SMH final low since 2011 came within two trading days of the peak in single-B or CCC spreads. Both made new highs for this episode on Friday.
The bull case is that credit peaks early. The stress this time sits with the leveraged builders while the hyperscalers fund themselves. If that holds, spreads can peak well below historical levels and the low is near.
No policy rescue. Three of the five prior lows came with a policy backstop. A cut, or a signal that the hiking cycle is one and done, looks unlikely with inflation currently where it is. That leaves the hyperscalers’ 2027 capex guides on October 28th and 29th as the catalyst.
Staying long SMH into the prints. The capex guide decides which scenario plays out, semis carry the strongest estimate revisions into it, and SMH and MAGS hedge each other on the guide. The scenario table below sets out the downside if it goes wrong: $436 to $378.
Forward returns from the ‑20% crossing
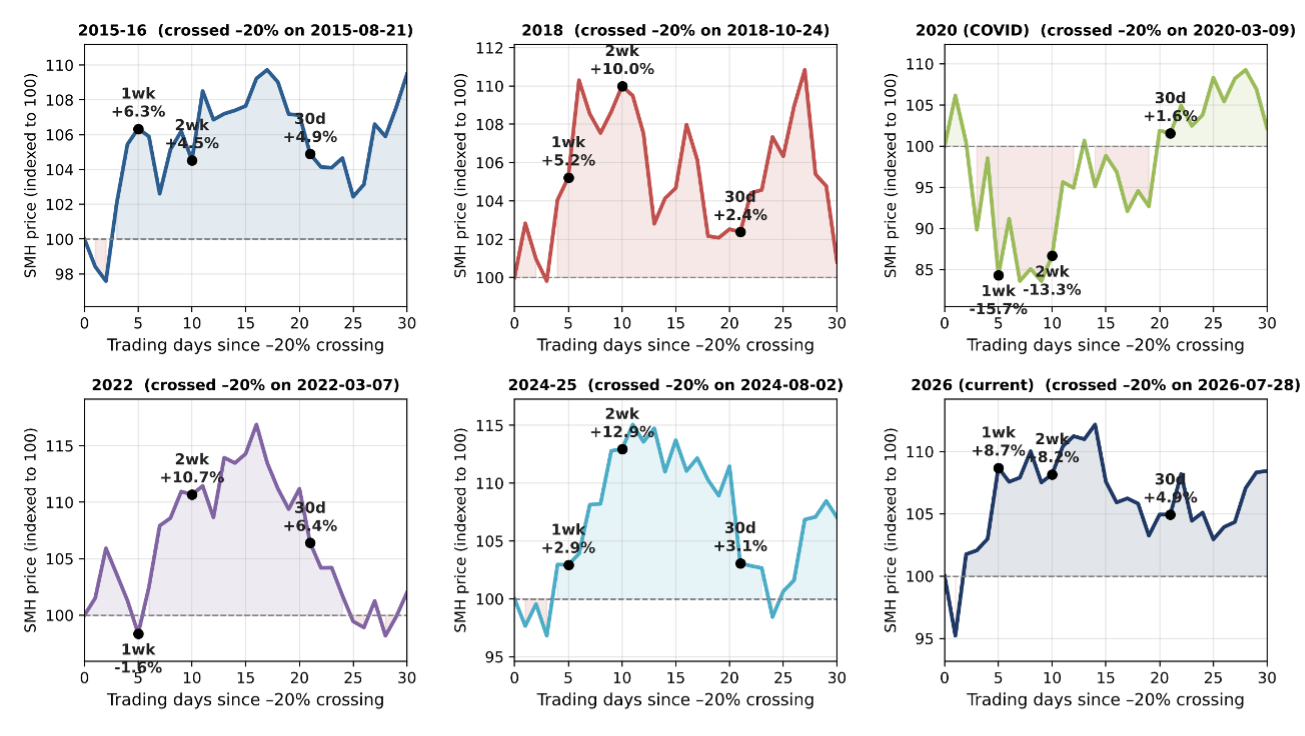
For each ‑20% SMH correction since inception (December 2011), I find the trading day the drawdown first crossed ‑20%, then measure returns 5, 10 and 21 trading days later, plus how much further SMH fell to its final low and how long that took.
Averages across the 5 completed episodes:
1wk mean ‑0.6% (median +2.9%, positive 60% of the time); 2wk mean +5.0% (median +10.0%, positive 80%); 30d mean +3.7% (median +3.1%, positive 100%).
Further decline to the final low averaged ‑14.8% (range ‑2.5% to ‑28.6%), over 99 trading days on average (range 9 to 170).
2026 fit the short-term pattern: +8.7% after one week, +8.2% after two and +4.9% at 30 days.