
September 2025 Inflation Preview
Labor Market Demand Story

Tomorrow the government is set to publish its preliminary estimate for September CPI. The Street is at .39% MoM for headline and .3% MoM for core.
Tomorrow’s release will have more than the usual fawning over the numbers given the ongoing government shutdown and data vacuum it has created. Expect extrapolations to be magnified beyond import, and for the cope to be at max levels.
Pinebrook has previously highlighted the feedback loops of a shrinking labor market on the demand side of the economy. This is likely to be manifested tomorrow as weak job growth and immigration trends weigh in on consumer discretionary spending.
The headline numbers will likely come in optically hot due to the effects of tariffs on food and food services. However:
Used cars will likely exhibit some deflation.
Rent/OER should continue on its disinflationary path after a surprisingly firm August.
Core services will come in cooler due to slowing airfares, while financial services will be warm to hot. Side Note: the Fed is now starting to fade FinServ price increases, much to the chagrin of the wealth effect people.
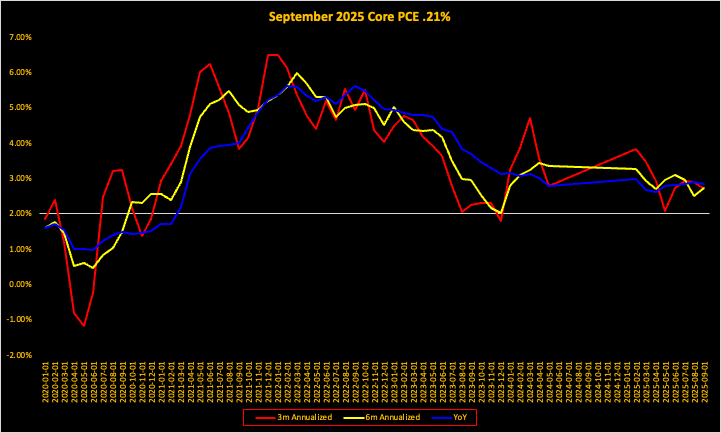
This puts the Pinebrook projection below the consensus for core CPI at
.25% MoM, which implies a core PCE estimate of .21% MoM.
In table form, the inflation evolution is laid out below.
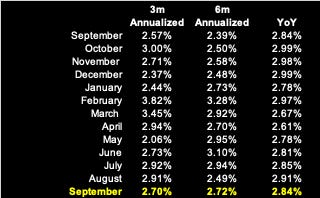
And in graphical form.
Due to the information vacuum created by the shutdown of government statistical agencies, the likelihood of an outsized market reaction to an outlier data set is orderd of magnitude greater.
Market positioning is currently bullish by all standards. Pinebrook’s preferred real-time gauge for investor sentiment is found in sectoral correlations to the broader market.
High sector correlations, closer to 1, indicate high levels of fear and anxiety, expressed as a classic risk-off.
Low sector correlations indicate the opposite, of higher levels of complacency as investors disengage from price discovery and become outright bidders of anything yieldy that is not nailed to the floor.
Sector correlations have now approached the 2-standard deviation level to the downside.
Currently at .456.
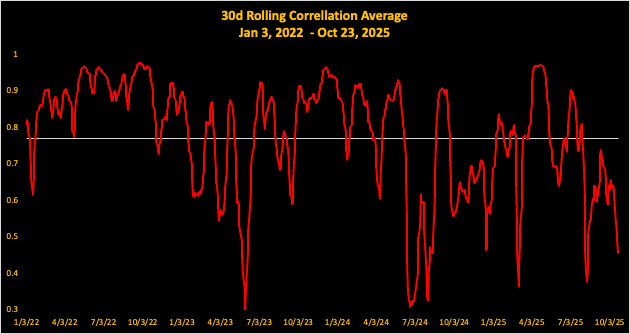
Now to be clear, correlation is not causation. In August of this year, sectoral correlations reached as low .37, almost 3-standard deviations below average of the post-pandemic era, with no detrimental market outcomes.
The current combination of an information vacuum, where a single high profile data print can have an outsized interpretive impact on the information surface, coupled with an almost lopsided market positioning, is something that short term traders should have an awareness of going into tomorrow’s CPI.
Hi David, not sure what tool/ticker you use for the correlation index graph you have shown. For someone who doesn't have access to bloomy, would you consider COR3M as a good proxy for sector correlation?