


Word has it that yesterday’s move in 10-year rates was like an earthquake that shook financial markets.
Real yields up 13bps (2.63% to 2.76%).
Nominal yields up 15bps (4.96% to 5.11%).
Sigma-scoring a single day’s move depends heavily on which lookback window supplies the volatility estimate, so the table below runs it four ways.
10Y Daily Move Distribution, By Lookback Window
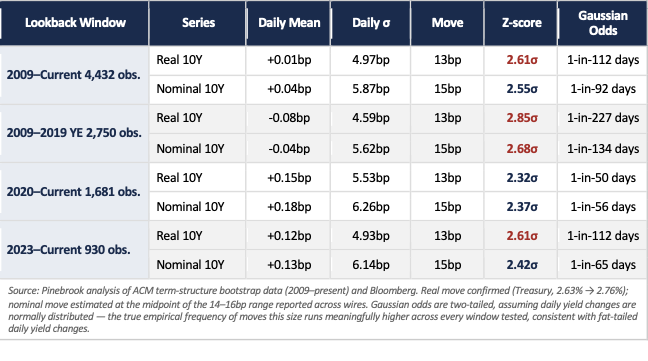
The pre-2020 window (lowest volatility of the four) scores yesterday’s move as the most extreme, 2.7–2.9σ.
The post-2020 window (highest volatility, shaped by COVID and the 2022 hiking cycle) scores it the mildest, 2.3–2.4σ.
The full-history and 2023-onward windows land exactly together on the real-yield read (2.61σ both), despite drawing on different sample compositions.
Shock Aftermath: Do These Moves Mean-Revert?
A sigma score says how unusual a move was. It says nothing about what happens next.
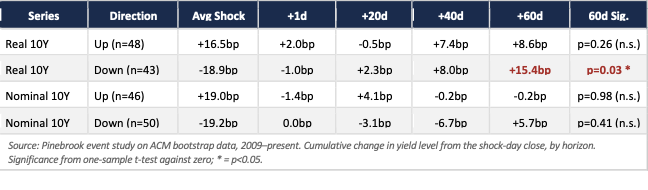
To answer that, every shock day in the full 2009 - present sample (|move| ≥ 13bp real, ≥ 15bp nominal, the same threshold used above) was isolated, split by direction, and tracked forward 1 to 60 trading days from the shock-day close.
Each result was also run through a one-sample t-test against zero, because most of what falls out of an exercise like this is noise.
Signal
Downward real-yield shocks mean-revert, and it’s statistically real. A sharp drop in real 10Y yields (average -18.9bp) has historically been followed by an average +15.4bp recovery over the next 60 trading days, basically retracing most of the move. Tested against zero: t=2.25, p=0.03. Tested against the more rigorous benchmark (the unconditional drift in real yields over any 60-day window in this sample, which is close to flat (+0.85bp)) the excess narrows slightly to +14.6bp but stays significant: t=2.12, p=0.04. Two-thirds of these episodes showed at least partial reversion by day 60.
The reversion is a quarter-length process. At 1 and 20 days out, the average path is still negative or flat and the recovery is concentrated in the 40 - 60 day window, not the days immediately following the shock.
The asymmetry is the other takeaway. Down-shocks in real yields behave differently from up-shocks in the same series. That directional split is a signal.
Noise
Real 10Y up-shocks look like continuation and not reversion, but it isn’t statistically proven. Average cumulative change kept building in the same direction out to 60 days (+8.6bp further), and only about half of episodes showed any reversion at all. Directionally consistent but p=0.26 means the sample doesn’t prove it.
Nominal 10Y shocks show no reliable pattern in either direction. A small 1-day fade after up-shocks fully unwinds by day 20 and the average just wanders from there, essentially flat by day 60, p=0.98. Down-shocks are equally directionless (p=0.41). Nominal moves include breakeven/inflation-expectation noise on top of the real-rate signal, which likely explains why they’re harder to read and noisier than the real series.
Sample sizes are thin enough that a single episode can move the average. Each bucket is 43 - 50 observations spanning very different macro regimes: the 2009 crisis, the taper tantrum, COVID, this hiking cycle.
Applied to yesterday
Yesterday was an up-shock in both series.
The one statistically robust pattern in this whole exercise (real-yield down-shock reversion) doesn’t apply here.
The directionally-suggestive-but-unproven pattern that does apply (real up-shocks tend to extend rather than revert) argues for yields staying elevated or drifting further over the next month or two, but the data doesn’t support a confident call.