
Market Commentary
The Dollar

Market participants are having their own worry episode as they conflate current USD cyclical weakness for a secular change in the currency’s reserve status.
The error is an easy one, as trade wars and a mafia-like diplomatic approach make for great narratives. In any event, if such a thing would happen it would be a process that would play out over time, mainly due to TINA – there is no alternative.
No other currency is as deep and liquid as the USD to transact in the $7 trillion daily currency market.
China has a closed capital account.
Europe is half-pregnant with an incomplete currency because there is no federalized budget that would allow for pan-European bond issuance for the entire Eurozone area, as opposed to current single-sovereign issuance.
There is a whole literature devoted to this space, which will not be summarized here for fear of getting a mind-numbing headache. For now, we will stick with U.S. Treasury Secretary John Connally’s dictum that the U.S. dollar is “our currency but it’s your problem”.
The first step in contextualizing the current dollar move is to look what it has done through time in various cycles.
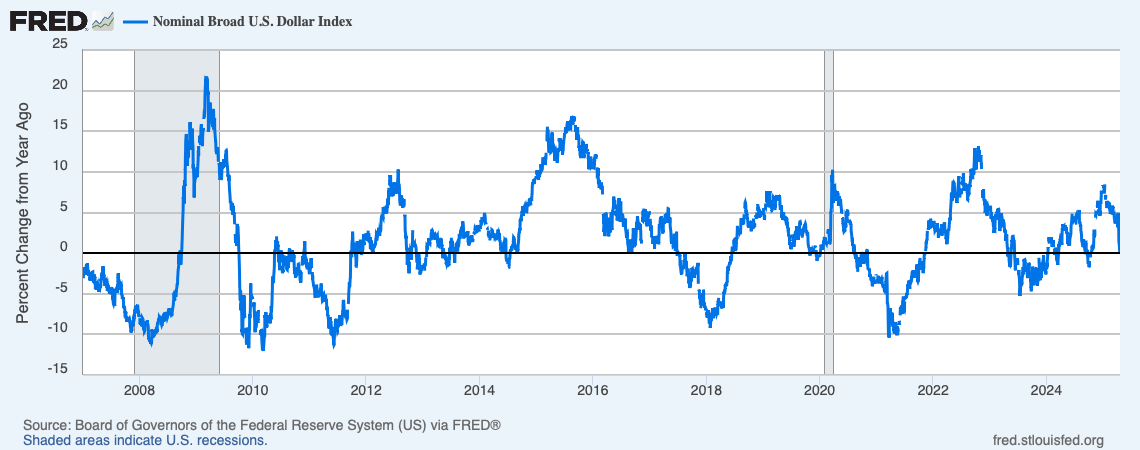
The first thing that stands out is that the dollar tends to appreciate as a crisis is brewing and it becomes the safe-haven asset of choice.
The second thing that stands out is that when ex-U.S. global growth is stronger than the U.S., the dollar underperforms other currencies.
Finally, when the U.S. growth is stronger, the dollar outperforms.
This strong-weak-strong dynamic was christened the dollar smile theory by Stephen Jen, Morgan Stanley’s foreign exchange strategist from around 20-years ago.

What is currently confusing observers is that the dollar has sold off since peaking in mid-January, despite rising geopolitical tensions due to President Trump’s trade war. This sell-off amid crisis has given rise to the idea of the dollar being abandoned and losing its safe-haven status.
Under the dollar smile framework, that is not an unreasonable conclusion. This framework, however, is likely outdated.
The reason it is outdated is because it does not take into account shifts in portfolio flows since the Global Financial Crisis.
Below is a chart of the U.S. net international investment position (NIIP). The NIIP captures the difference between two large numbers: the value of U.S.-owned assets abroad (foreign assets) and the value of foreign-owned assets in the U.S. (foreign liabilities).
The NIPP determines whether a country is a net creditor (positive position) or a net debtor (negative position) and is an important indicator of a country’s financial condition.

This is what the U.S. NIIP is as a percentage of GDP.

Here is the compositional distribution of the NIIP.
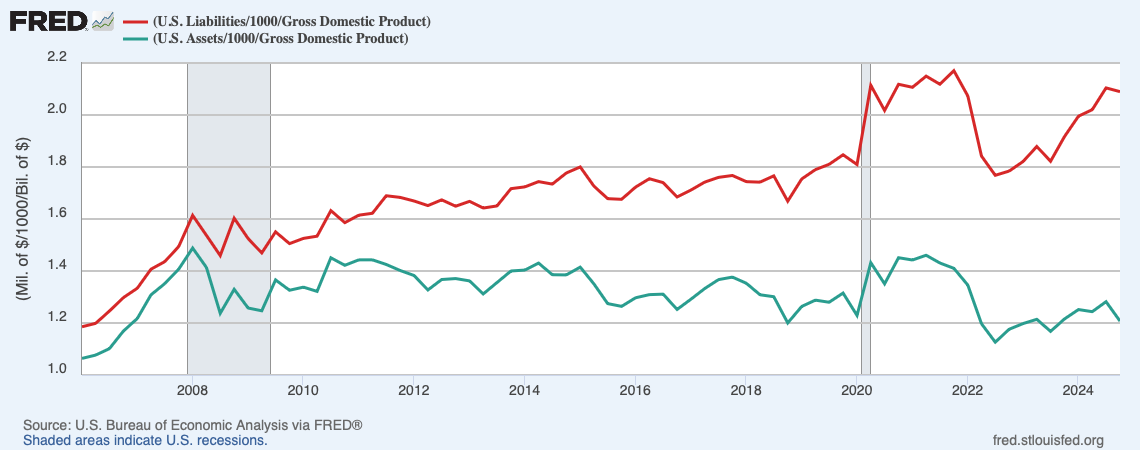
At the start of the GFC, assets and liabilities began to diverge, with assets falling by about 30% of GDP and liabilities rising by 10% of GDP in the GFC aftermath. This divergence continued in the post-GFC years but exploded with the Covid pandemic.
A casual observation would lead one to conclude that a falling asset position and increasing liability position would threaten the sovereign solvency of the United States. Such a casual observation would be incorrectdue the fact that assets in the above charts are U.S. owned foreign assets, and the liabilities represent foreign owned U.S. assets.
In a paper called “The End of Privilege, A Reexamination of the Net Foreign Asset Position of the United States” Atkeson et al. (NBER Working Paper 29771) find that most of the change can be explained by a boom in US equity values that was not matched by foreign stock prices.
In the early 2000’s, the most common explanation for the U.S.’ small net foreign asset position (NFA) was that Americans owned high-return foreign equities while foreigners held low-return US assets such as Treasury bonds. Data available at the time supported that view.
By looking at newer and better data that captures economic and financial flows and balance sheet positions, the researchers find that the relative performance of foreign and US holdings within asset classes, rather than differences in the type of assets held, accounts for most of the changes in the US NFA position between 2010 and 2021.
Since foreign investors own roughly 30 percent of the US corporate sector, their share of the increased profitability of this sector corresponds to an annual flow of about 1.3% of US GDP.
The dollar smile farmwork does not capture the dynamic of massive inflows into the U.S. driven by U.S. equity outperformance.
In previous recessions, U.S. capital in risk assets would be repatriated back to the U.S., strengthening the dollar.
Today, given the net position, capital will instead be going back to international markets.
This is consistent with the notion that U.S. corporate profits as a percent of national income are running at multi-decade record high levels. The chart below shows the growth in corporate earnings and their percent of national income from 2001 to 2024.
Nominal profits more than doubled from 2010 to 2024.
As a percent of national income, they went from an average of 13.9% (2010 – 2019) to 16.2 % in Q4 2024.

The world loves U.S. assets due to their superior profitability.
The capital that arrived in the US was mostly unhedged. As funding costs in the US have risen, the cost of hedging US assets back into local currencies has mooned for foreign investors. It’s been a great trade not to hedge given recent USD outperformance!
The reverse of this – a U.S. investor going into foreign equities - likely hedges back into USD to avoid FX losses when swapping back into an appreciating dollar.
This creates two pressure points for the US dollar:
In a risk-off, foreigners sell their U.S. equities and repatriate cash. This is USD is negative and positive for the foreign FX pair.
Secondly, in a recession, the Fed cuts interest rates significantly and U.S. rates converge lower to DM peers. Even if foreign investors do not sell their U.S. assets, they do have an incentive to hedger their cash flows from those assets by selling dollars.
Finally, the establishment of dollar swap lines between the Fed and all of the DM and some EM central banks means that in times of stress, there is an abundance of dollars as opposed to a scarcity of dollars, which limits dollar appreciation in times of stress.
The framework that better captures the global currency landscape is the dollar smirk theory.

In this framework, capital flows into the U.S. since the GFC and post pandemic periods, along with the high cost of hedging due to the higher rate regime in the U.S., means that times of stress weaken the dollar.
Having a mechanical, data-driven understanding of the above allows investors to dispense with dollar doom hysteria. Instead, one might simply conclude that the U.S. economy is heading into a late cycle expansion that may or may not turn into a recession.
If……the U.S. economy manages to avoid a recession, or if the recession is shallow and/or short in duration, this dynamic will likely reverse itself provided the current administration does not introduce too many burdensome distortions to trade and to the U.S. economy.
Concluding Remarks
Fade dollar-doom fears based on geopolitical negotiations taking place in the news flow, as opposed to actual real-life negotiations with coherent objectives and strategies.
Embrace a flow-driven framework to better understand currency movements.
A dollar smirk framework better reflects the post-GFC realities of more globally integrated financial flows.
It’s the business cycle, and the dollar is simply reflecting this.
Dollar smile, man i rem that. Great job.
Do you give any weight to the theory that flows were the source of US outperformance not the result?