
Market Commentary
The Small Caps Trade – U.S. Sectoral

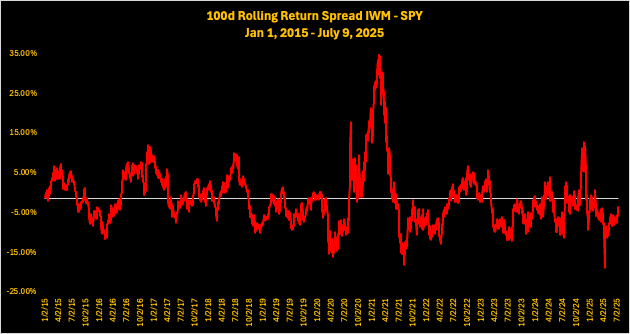
The Russell 2000 small cap index (“R2K”) has finally broken into the green on a YTD basis, if just barely so at 1.74%. It is now trailing the S&P500 by 5.04%, which is up 6.78% YTD (as of July 10, 2025).
Since 2010, the R2K has underperformed the S&P500 by an average of 1.43% on any given 100-day rolling period.
Since 2020, this spread has increased to an underperformance difference of 2.12%.
Since 2023, when the current bull market really got going after the October 2022 low, this average spread has again increased to 4.19%.
Currently at 3.42% underperformance, the underperformance spread was at 7.58% 1-week ago (over 1-sigma) when the long small caps thesis was ideated on these pages before the July 4th holiday (long U.S. small caps versus short European small caps).
Despite the narrowing of this spread, there is still room to run on the U.S. small caps to U.S. large cap catch up trade.
As discussed in prior market commentary, there are structural reasons for why smalls have lagged the biggies, mainly:
The emergence of private equity as a bidder for high quality pre-IPO smalls, which keeps these firms private before they can go public and renders the residual IPO listings as a freak show collection of ugly ducklings.
Small caps’ lack of Big Tech exposure, which have global scale and hyper-growth, and sustainable profit margins the size of a football field.
The above is manifested in sectoral weight composition and performance of smalls versus their large cap counterparts.