
Market Commentary
The International Opportunity Set

Time will not be wasted picking apart the nuances of Friday’s job’s day report. The big number, the one that matters for policy, the unemployment rate, showed a marginal improvement from 4.5% to 4.4% (rounded).
This kicks the can on policy rate cutting prospects out to the latter half of H1 this year.
Instead, these pages will focus will on the trade that is staring us right in the face, the non-US one. And this is why.

Yes, U.S. assets are underperforming. Thank you very much, captain obvious. But there is something else here.
Spot the performance differential between EWJ, the MSCI-index based ETF for Japan, and the DXJ, the Wisdom Tree-sponsored Japan ETF.
5.6% for DXJ vs. 4.79% for EWJ, YTD for calendar 2026.
30.65% in 2025 for DXJ vs. 19.91% for EWJ.
There are many differences between the two instruments due to the kind of companies they select for their composition.
EWJ is a market-cap based index, which includes large and mid-caps, across sectors.
DXJ is dividend-weighted and excludes firms that derive most of their revenue from within Japan. This gives DXJ a heavy tilt toward exporters (like Toyota or Sony), which historically benefit most when the yen is weak.
By far the biggest differentiator of returns between the two instruments is the currency factor.
When you buy EWJ, you are essentially making two bets: one on Japanese stocks and one on the Japanese yen. If Japanese stocks go up but the yen loses value against the dollar, your total return in USD will be lower. Conversely, if the yen strengthens, it acts as a tailwind for returns.
DXJ uses financial contracts to cancel out the movement of the yen. You only get the return of the underlying stocks. This is a currency neutral pure play on the Japanese equity market for USD-based retail investors.
Despite all the big talk about Abenomics and Kurodanomics in 2013, the Japanese yen did not start its secular depreciation until 2021.
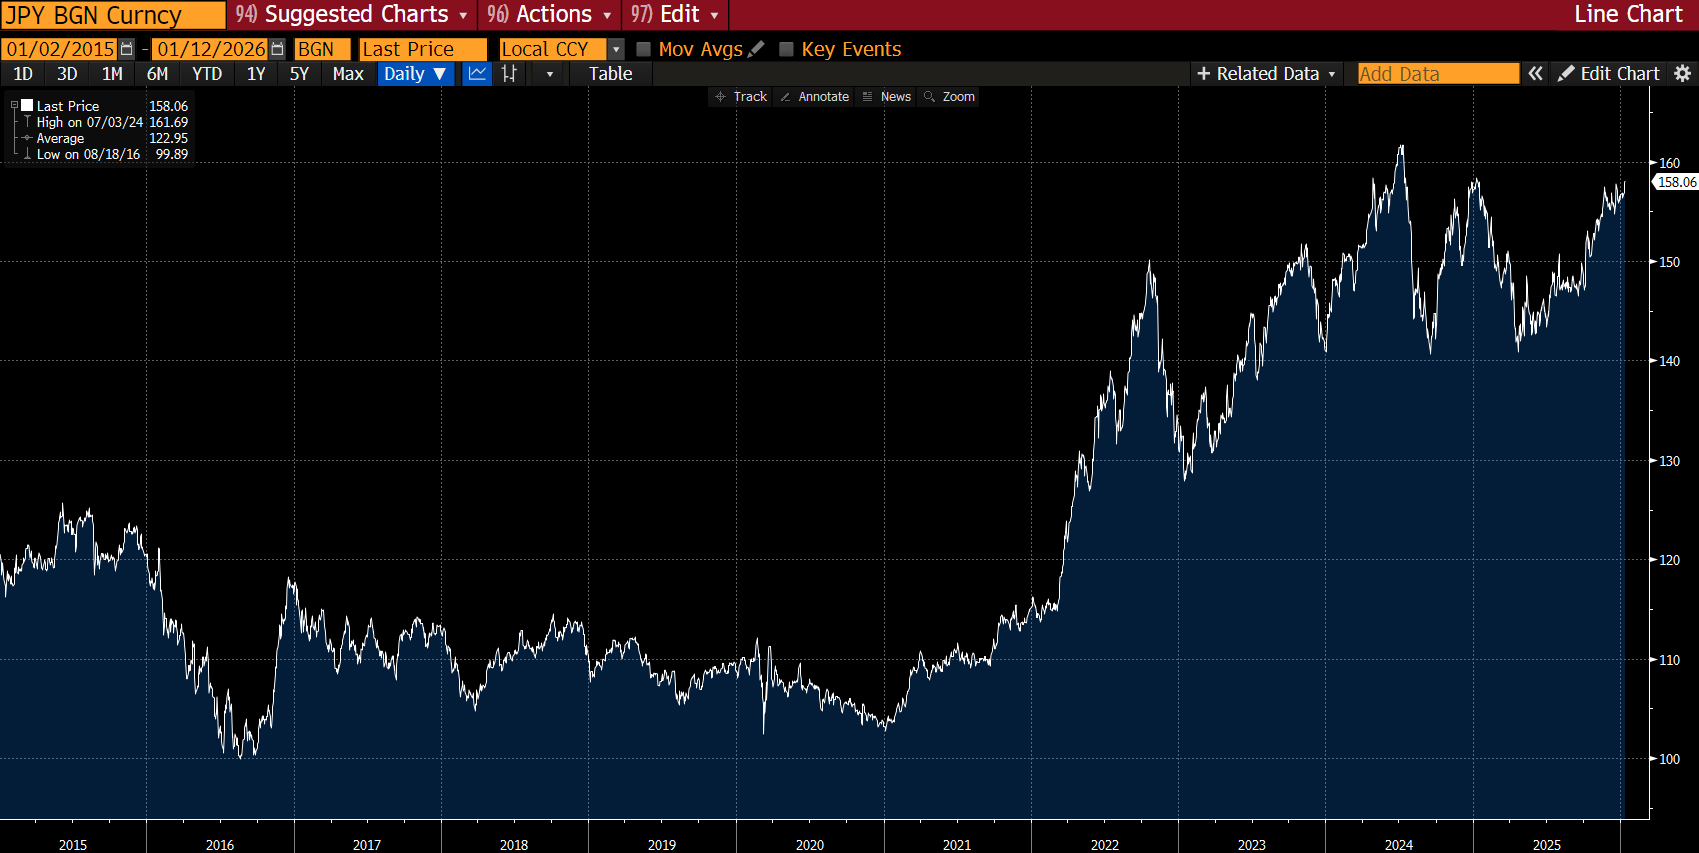
The resulting currency-based outcomes on the two instruments is dramatic. Starting in 2021, EWJ began to significantly underperform DXJ.
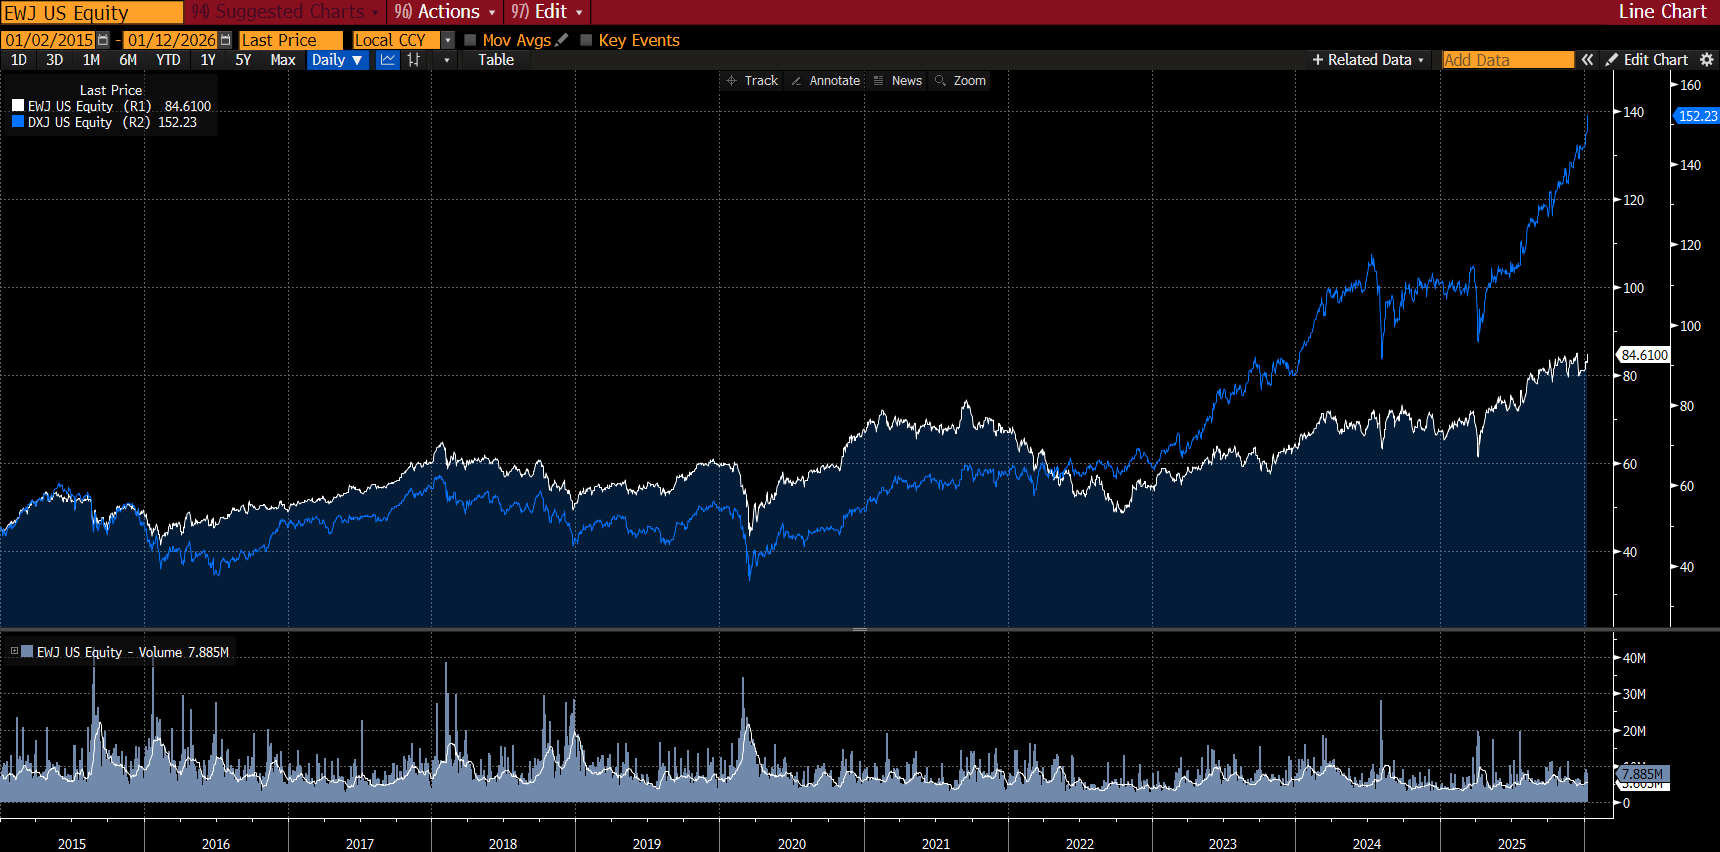
EJW (USD) total return January 4, 2021 – January 9, 2025: 43.14%.
DXJ (USD) total return in the same time frame: 228.43%.
Further illustrating the currency impact on national index returns, the Nikkei 225 index has kept up with the S&P500 on a pure index basis, but like EWJ, has lagged when adjusted for currency conversion into U.S. dollars.
From January 4, 2021 – January 9, 2026:
Nikkei 225 (JPY) total return 109.84%.
S&P500 total return 102.45%.
Nikkei 225 total return (USD) 36.99%.
It’s still a dollar story. Always has been.