High Frequency Data Note
ISM Services
Financial commentary made a mountain out of a mole hill yesterday when discussing the underwhelming ISM manufacturing data released yesterday.
Pinebrook is fading this noise. Manufacturing is a decreasing part of the U.S. economic pie.
Tomorrow ISM services data will be released.
Instead of focusing on the noise of any one print, the preferred framework for viewing this data is on a 3-month moving average basis to smooth out the time series, and then underweight the manufacturing component relative to the services component to account for the size and growth contribution of each sector.
Smoothing out the ISM manu headline and new orders data gives us this chart.
As can be seen, manufacturing has been in contraction (sub-50) since late 2022. Outside of an anomalous pop in late 2024, yesterday’s ISM manu headline and new orders sub-index are trending par for the course in this recovery.
The more economically important services sector data reveals another story.
Again, there was strength in late 2024, but ISM services has been skating along this trajectory since late 2022, showing constant expansion.
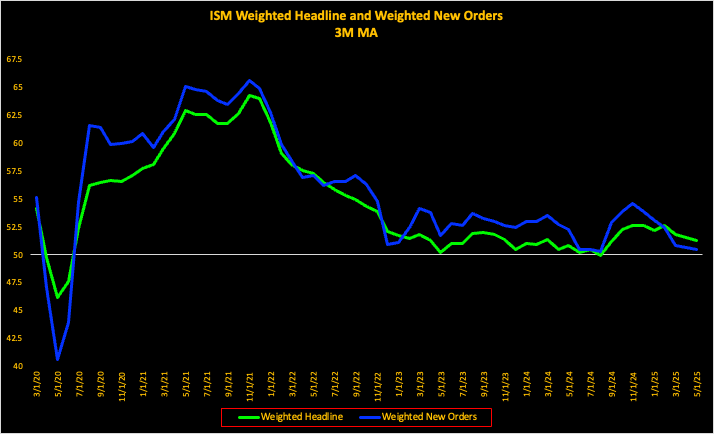
A chart that weighs these moving averages by assigning manufacturing a 25% weighting and services by 75% reveals the following.
Tomorrow the ISM headline and services prints will be released. For the weighted 3-month moving average of these two data series to fall below 50 and signal broad economic contraction:
ISM headline will have to come in at 48.8 or below versus a 52 expectation.
ISM new orders will have to come in at 50.6, relative to last month 52.3 print.
Both above would be considered tail events that deviate from current expectations and recent history.
Tails are a thing, and they happen. Absent a tail event, even soft prints should be faded tomorrow.


Such kind of timely short notes are incredibly helpful not just from a trading perspective but as much from a macro learning perspective. Thank you so much.
Good work. Today's print was what in the UK would be referred to as squeaky bum time.