


I. Why This is Not a Forecast
Historical rate-cycle comparisons work the way cloud-shapes work.
Stare at a cloud long enough and it will eventually look like a rabbit or a unicorn.
Stare at a rate hiking cycle long enough and you’ll find one that looks like today’s, or the one your imagination prefers.
That doesn’t mean today’s cycle is 2004, or 2015, or 2022. It means a pattern-seeking mind found a shape it wanted to find.
Lean on that shape as if it were a forecast, and the market rinses you the moment this cycle turns out different, which it will because every cycle differs from every other one.
That’s the discipline of this note: historical look back windows are context, not signal.
They answer a narrow question: is today’s number large or small relative to some comparable past, and has a particular factor shown up before? And nothing more.
They cannot tell you what happens after Wednesday’s decision, because no two Fed committees, no two starting curves, no two sets of political and fiscal conditions are the same.
What decides the outcome is today’s data and today’s FOMC’s actual reaction function, not what a different committee did with a different curve in a different economy.
Thus, this note is not a forecast. It is a framework for outcomes under genuine uncertainty. Where the historical record is used, it is used to check whether something is stretched or ordinary, not to imply a path forward.
Therefore, tomorrow’s decision is discussed as a branching set of possibilities with a trigger and a risk for each.
II. Defining the Look Back Window
It’s tempting to look at every single Fed hike cycle back to whenever.
That will not be done to you, dear reader.
Why Not Pre-2000
The 1986-87, 1988-89, and 1994-95 cycles predate inflation targeting, predate the modern Summary of Economic Projections process, and predate a Fed reaction function shaped by two decades of disinflation, the 2008 crisis, and a zero-rate era.
The global monetary system those cycles traded in - pre-euro, pre-China-as-a-reserve-manager, a structurally different Treasury market - doesn’t match today’s plumbing.
Including them doesn’t add data as much as it adds noise dressed up as sample size.
The Sample
Primary sample (n=3): 2004–06, 2015–18, 2022–23. Every multi-hike cycle since the Fed’s inflation-targeting era matured and the modern SEP process existed in something like its current form.
Robustness cut (n=2): 2015–18 and 2022–23 only, because both started from the zero lower bound with a QE overhang.
Of the three, 2004–06 is the closest structural analog to today. It’s the one cycle that started from a normal, non-crisis, non-zero-bound base, with a steep positive curve, closest to the actual starting conditions in front of the Fed tomorrow.
2022–23 started from a totally different place (deeply negative real rates, a curve about to invert) and 2015–18 started at the zero bound.
III. What the Record Shows on the Narrower Window
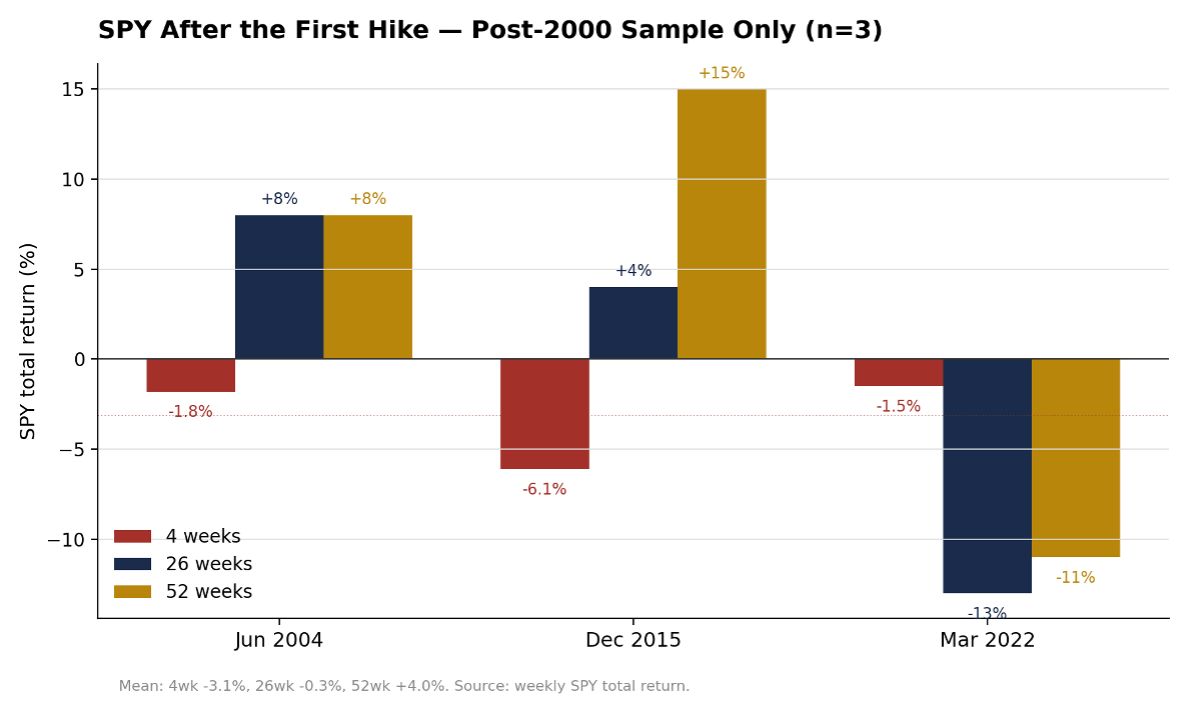
Figure 1. SPY total return following the first hike of each cycle, post-2000 sample only (n=3).
4-week mean: -3.1%.
Only two of three cycles were still positive at 26 weeks. The 26-week mean drops to essentially flat (-0.3%) once 2022’s -13% is weighed against 2004’s +8% and 2015’s +4%.
The 52-week mean holds modestly positive (+4.0%, 2 of 3).
Financials and Utilities
Across the sample size, financial and utilities they were the worst and best-performing sectors after a first hike. And it’s not even close. They are literally the bottom and top of the list every time.
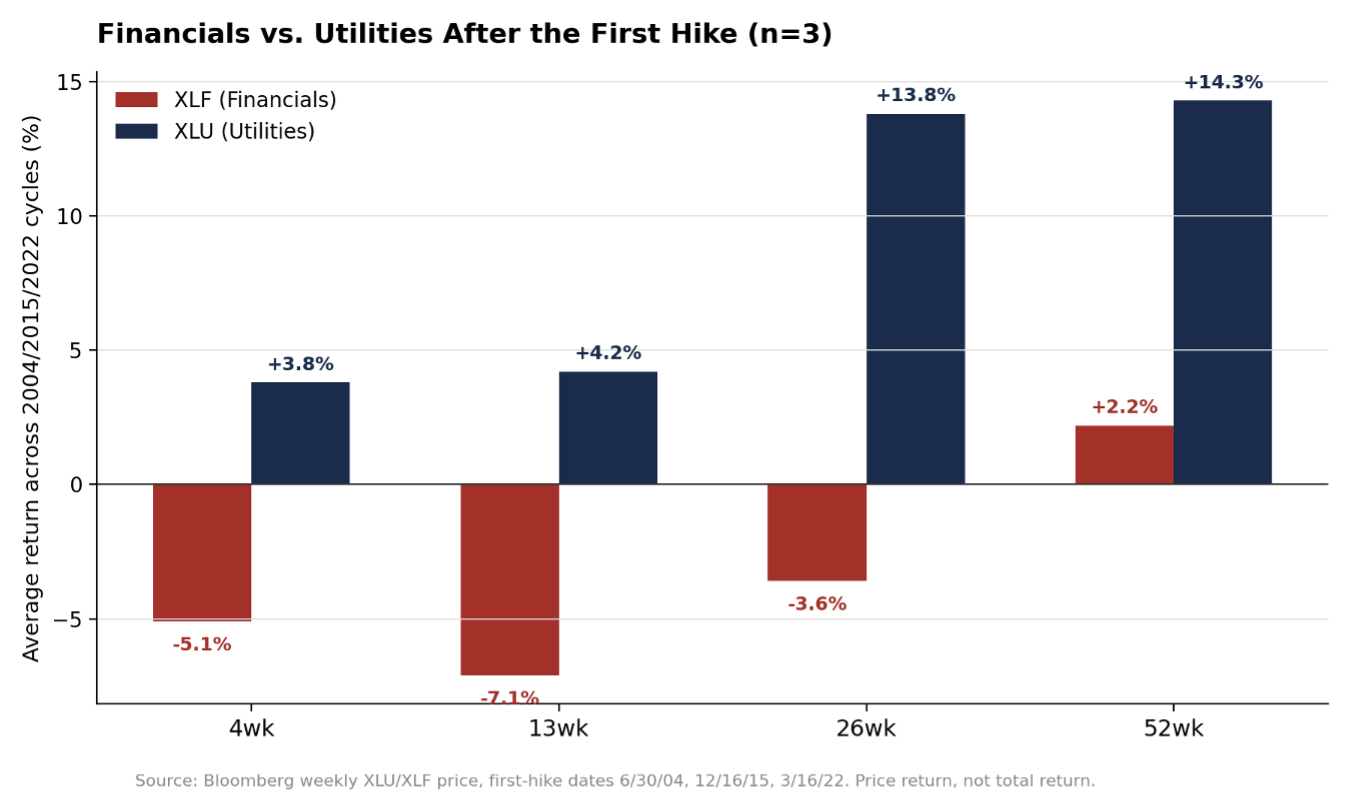
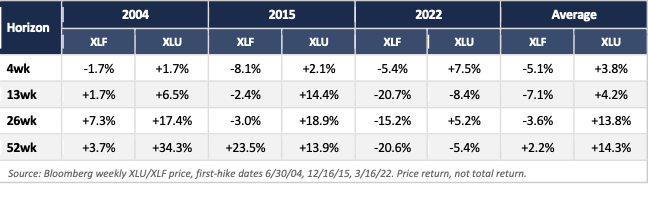
Financials negative in all three cycles at 4 weeks. Utilities positive in all three.
Rates: The Selloff Front-Loads, and This Curve Doesn’t Match Any Precedent
By the time a hike actually lands, the curve has usually already done its front running pricing work. The hike itself is a confirmation exercise, not news, unless the Fed is playing catch-up as in 2022.
Thus, 7–10Y Treasuries sold off into the first hike in all three cycles, then rallied after it in two of three, 2022 being the exception.
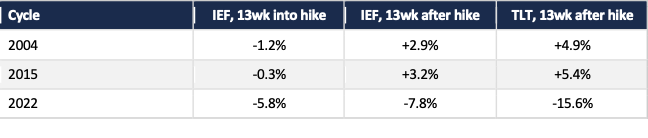
Now that said, today’s curve doesn’t match the shape behind any of the three historical samples. Pulling the actual pre-hike curve for each of the three cycles (6/30/04, 12/16/15, 3/16/22) against today’s gives the genuine apples-to-apples curve comparison.
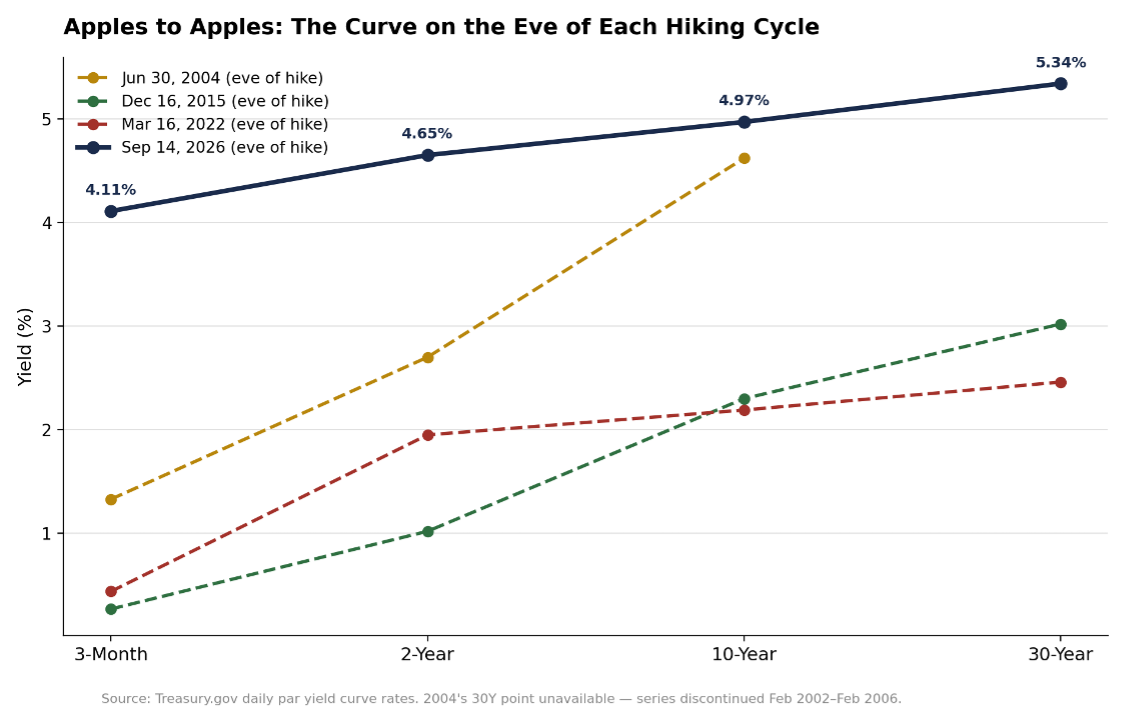
Today’s curve sits above every prior hiking-cycle onset, at every maturity.
The gap is starkest at the front end: 3-month bills sat at 1.33%, 0.27%, and 0.44% on the eve of the last three cycles; today they’re at 4.11%.
The Fed is about to hike from an already-elevated policy rate, not from near-zero or modest levels like every comparable cycle onset.
2004’s 30-year point doesn’t exist, as Treasury discontinued that series between February 2002 and February 2006.
IV. The Regime Question
Last week’s note already built the case that the real question isn’t the yield level but whether the 25-year low-beta regime is ending.
That hasn’t changed. What’s new since then is a way to put an actual number on the gap.