
April ISM
The Expansion That Isn’t Allowed to Celebrate

Last week, on May 1, we got ISM Manufacturing the and forward-looking new orders for that time series. 52.7 and 54.1, respectively. Today we got the same for ISM Services at 53.6 and 53.5, respectively.
To smooth the data, we take a three-month moving average of each time series and assign weights that represent their rough contributions to U.S. economic output: 25% to manufacturing and 75% to services.
Doing so produces a graph that looks like this.
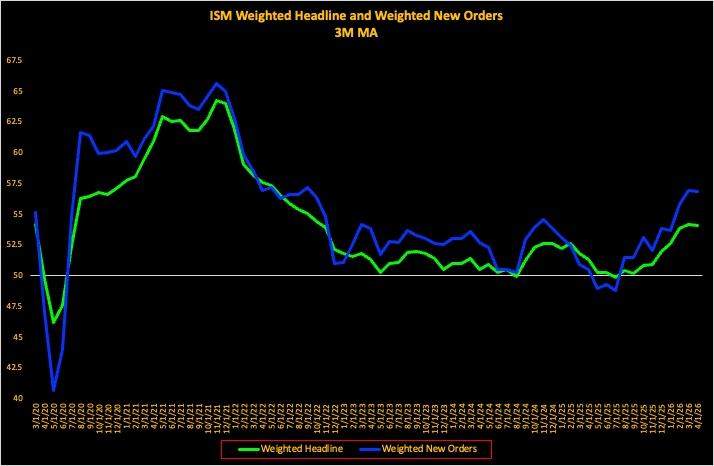
Strong Numbers. Complicated Story.
On the surface, the April ISM prints are unambiguously good. Both manufacturing and services are expanding. New orders in both series are above 53, a level that historically points toward continued output growth over the following two to three quarters. If you stopped reading here, you could write a straightforward bullish note.
We are not stopping here.