

EXECUTIVE SUMMARY
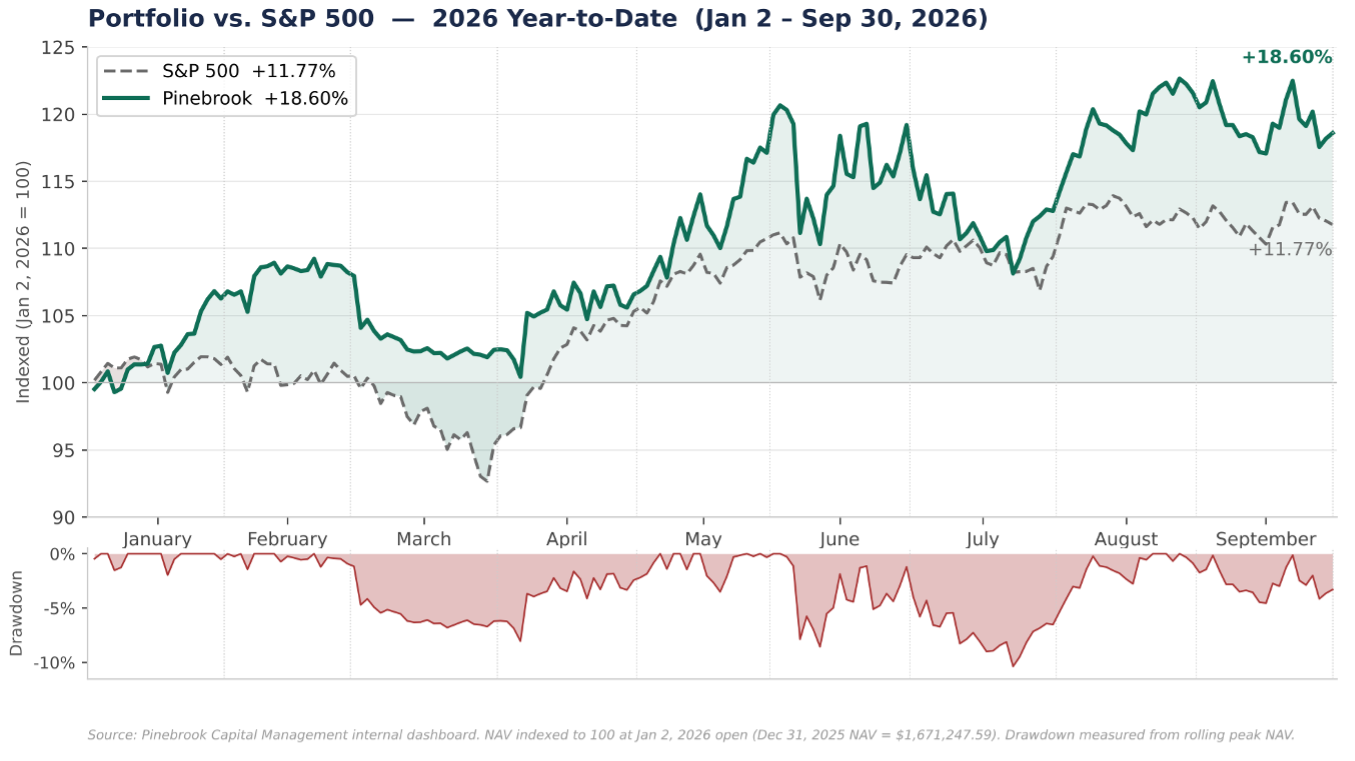
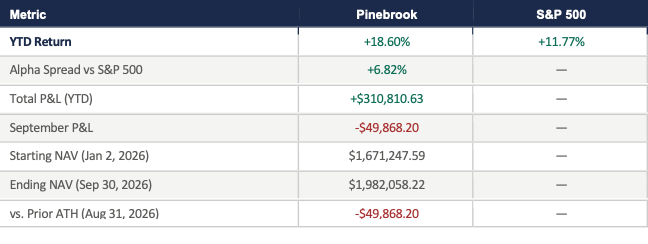
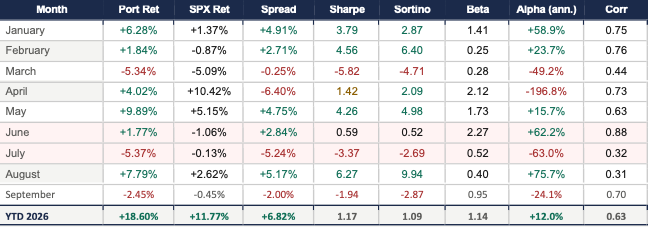
Pinebrook generated a +18.60% return for the period January 2 through September 30, 2026, against an S&P 500 return of +11.77%, for a spread of +6.82%.
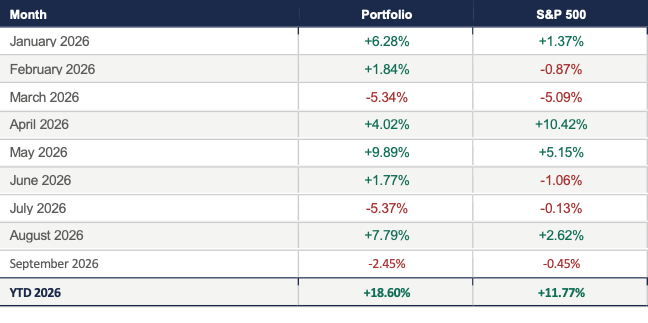
September produced a -2.45% return against the S&P 500’s -0.45%, a -2.00 percentage-point spread after August’s +7.79% month.
The September setback followed a meaningful book reset: the Japan pair, rates exposure and gold-miner positions were the principal headwinds, while TSM, IGV and the industrial short basket provided substantial offsets. Ending NAV was $1.982 million, still +18.60% YTD and +98.21% since inception on August 5, 2026.
EQUITY CURVE VS. S&P 500
PERFORMANCE SNAPSHOT
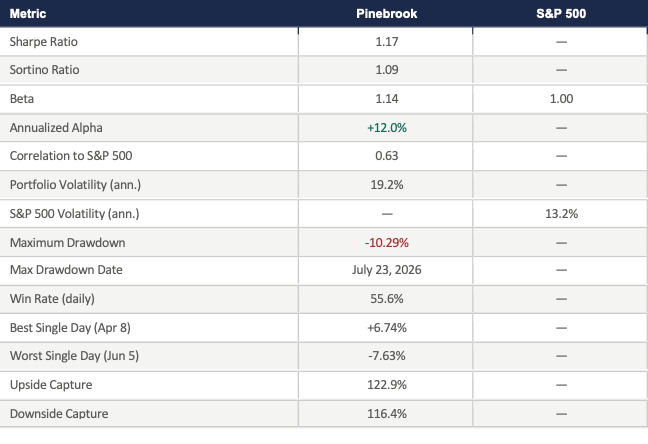
RISK METRICS — YTD THROUGH SEPTEMBER 30, 2026
MONTHLY RETURN BREAKDOWN
MONTHLY RISK METRICS — 2026 (PART I)
MONTHLY RISK METRICS — 2026 (PART II)
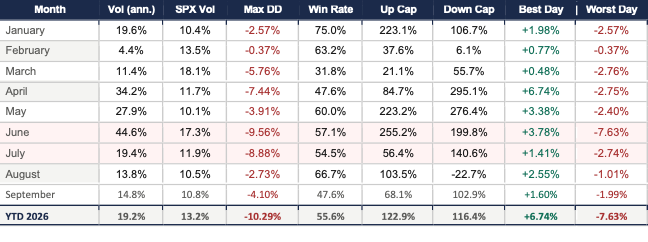
Volatility, drawdown, win rate, capture ratios, best and worst observations by month. YTD row is calculated from the nine monthly return observations through September.
PORTFOLIO COMMENTARY
January – August: Summary
The portfolio entered September after a +7.79% August, its strongest risk-adjusted month of the year. The July 13–16 repositioning had materially improved the book, but the September result shows that the portfolio remained exposed to several concentrated factor moves, particularly gold miners, Japan and rates.
September: -2.45%
September produced a -2.45% return against the S&P 500’s -0.45%, a -200 basis-point spread. The month was volatile: the reconstructed daily series produced a -4.10% maximum drawdown, with the worst day on September 28 (-1.99%) and the best day on September 21 (+1.60%).
The clearest positive trade-level contributors were TSM (+$33,963) and IGV (+$25,853), both closed September 22. The GEV and CAT shorts also generated +$7,594 and +$11,177 respectively. Those gains were partly offset by the Japan pair: the DXJ longs generated about +$16,141 while the EWJ shorts lost about -$29,300, for a net Japan-pair drag of roughly -$13,159.
Gold miners also reversed part of August’s gains. The four GDX/GDXJ tranches lost roughly $28,525 on the September move, while MAGS gained about $12,219, leaving the existing gold/mega-cap basket down approximately $16,306. Rates were another material headwind: the two ZN positions and the ZT position produced combined September losses of approximately $25,540.
The book was repositioned again on September 21, adding SMH and XLK longs, an XLE short, an XLV short and an NQ futures long. Those new positions were collectively up approximately $12,311 by month-end. The September result therefore reads less as a wholesale thesis failure than as a month in which several previously profitable concentrations reversed at the same time.
ON THE RISK METRICS
September’s monthly metrics are negative across the board, with a Sharpe of ‑1.94 and Sortino of ‑2.87. Beta of .95 and correlation of 0.70 show the book moved closely with the market day to day, but the S&P 500 fell only ‑0.45% for the month; annualized alpha of ‑24.1% shows that most of the loss came from position-specific moves in rates, gold miners and Japan rather than from market direction.
YTD metrics softened from their restated August 31st levels: Sharpe from 1.20 to 1.17, Sortino from 1.18 to 1.09, annualized alpha from +14.8% to +12%, and downside capture from 108.6% to 116.4%. The maximum drawdown of ‑10.37% (July 23rd) is unchanged; September’s ‑4.1% intra-month decline did not approach it. Beta moved from 1.08 to 1.14 and correlation from 0.58 to 0.63. The portfolio ended September ‑2.45% below its August 31st month-end high.
TRACK RECORD
Portfolio performance since inception in August 2024.
